The application’s Overview page is the dashboard for a selected project. It summarizes whether the monitoring fleet is ready to run checks and points you to the product area that can explain or correct a problem.
Select The Project
Netstamp keeps probes, checks, labels, alert rules, and status pages inside projects. Use the project switcher in the application navigation before interpreting Overview. A healthy probe count in one project says nothing about another project’s fleet.
If you have not joined a project yet, create one or accept a project invitation. See Projects and members.
Probe Health
The probe summary separates the fleet into these operational states:
- Online probes are actively sending heartbeats to the controller.
- Offline probes have stopped reporting within the expected window.
- Draining probes are disabled. They remain registered, but should not receive normal monitoring work until they are enabled again.
The counts use every probe in the selected project. Open Probes to inspect heartbeat time, agent version, IP-family support, or installation state for one machine.
Map Coverage
The coverage card compares the number of registered probes with the number that have geographic coordinates. The network map can only place probes with a known location, so its marker count may be lower than the total fleet count.
Locations may come from the address search in the probe editor or from manually entered latitude and longitude. A missing map marker does not mean that a probe is offline.
Active Checks
The check summary counts enabled monitoring definitions and groups them by type. Netstamp currently supports:
- Ping;
- TCP connect;
- HTTP or HTTPS;
- Traceroute.
Open Checks to add, edit, disable, or assign a check. A check definition alone does not guarantee execution: its selector must resolve to at least one eligible probe. Use Labels and assignments to verify that relationship.
Network Map
The map shows the positioned probes in the current project. Use it to spot geographic gaps and confirm that monitoring originates from the locations you intended.
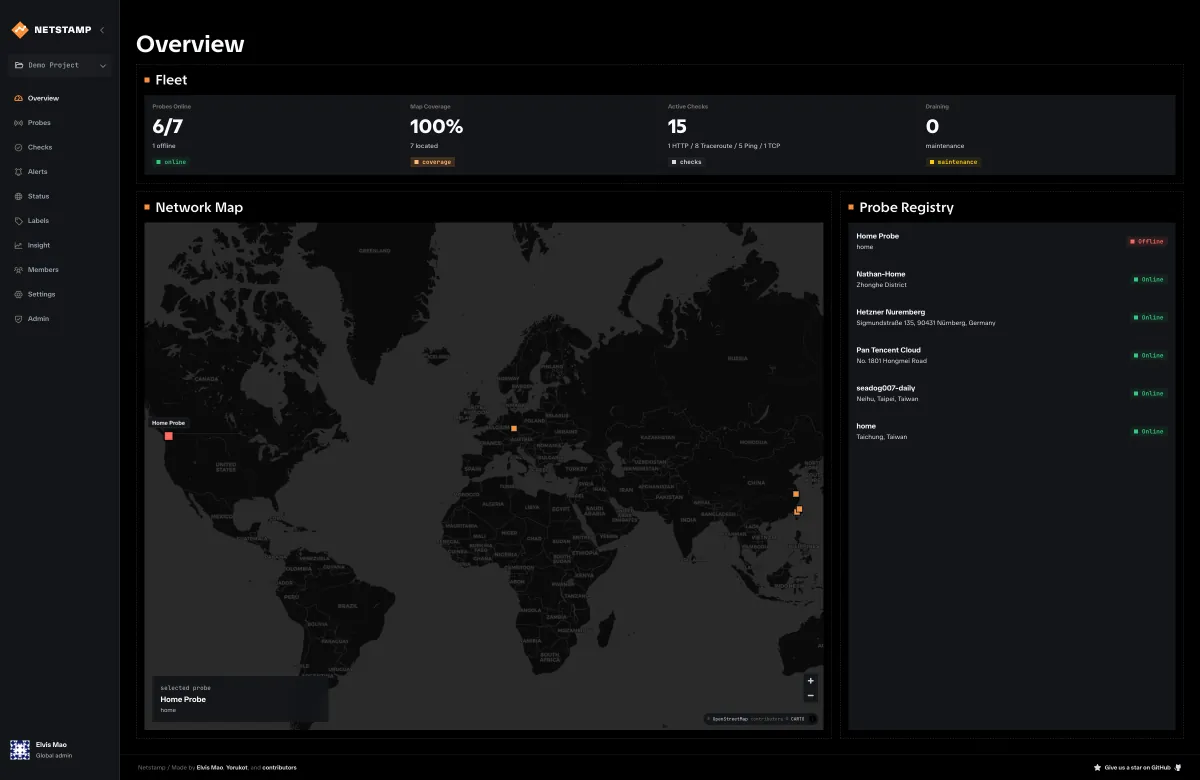
The map represents probe locations, not traceroute paths. Open Insight and select a Traceroute check to explore hop topology and individual runs.
Probe Registry
The registry lists a small, recent slice of the fleet with each probe’s status and identifying details. It is useful for jumping from a high-level count to a specific probe, but it is not the complete inventory. Open the Probes page to search, filter, map, and manage the full fleet.
A Practical Triage Sequence
When Overview signals a problem:
- Confirm that you selected the expected project.
- Open an offline or draining probe and inspect its last heartbeat and installation state.
- Confirm that active checks resolve to the intended probes.
- Use Insight to compare recent measurements across probes and checks.
- Review incidents and notification delivery only after verifying the underlying probe and assignment state.
This order helps distinguish a monitoring target failure from a disabled probe, a stale agent, or a selector that matches nothing.