The Overview page summarizes project health. Insight is the investigation workspace for a selected check, probe scope, metric, and time range.
Choose the right scope
Start with the affected check, then compare:
- one probe against its own history;
- several probes against the same target;
- a region or provider group;
- all assignments for the check.
This separates target-wide failures from a route, provider, location, or probe problem.
Ping analysis
Ping series include average, minimum, and maximum latency plus loss percentage. Result details also retain median, standard deviation, and raw RTT samples when available.
Look for correlation between rising loss and latency, a single outlier probe, or a step change shared by multiple viewpoints.
TCP analysis
TCP series include average, minimum, and maximum connect duration plus failure percentage. A healthy ping with failed TCP may indicate a port, firewall, listener, or transport-specific problem rather than general reachability.
HTTP analysis
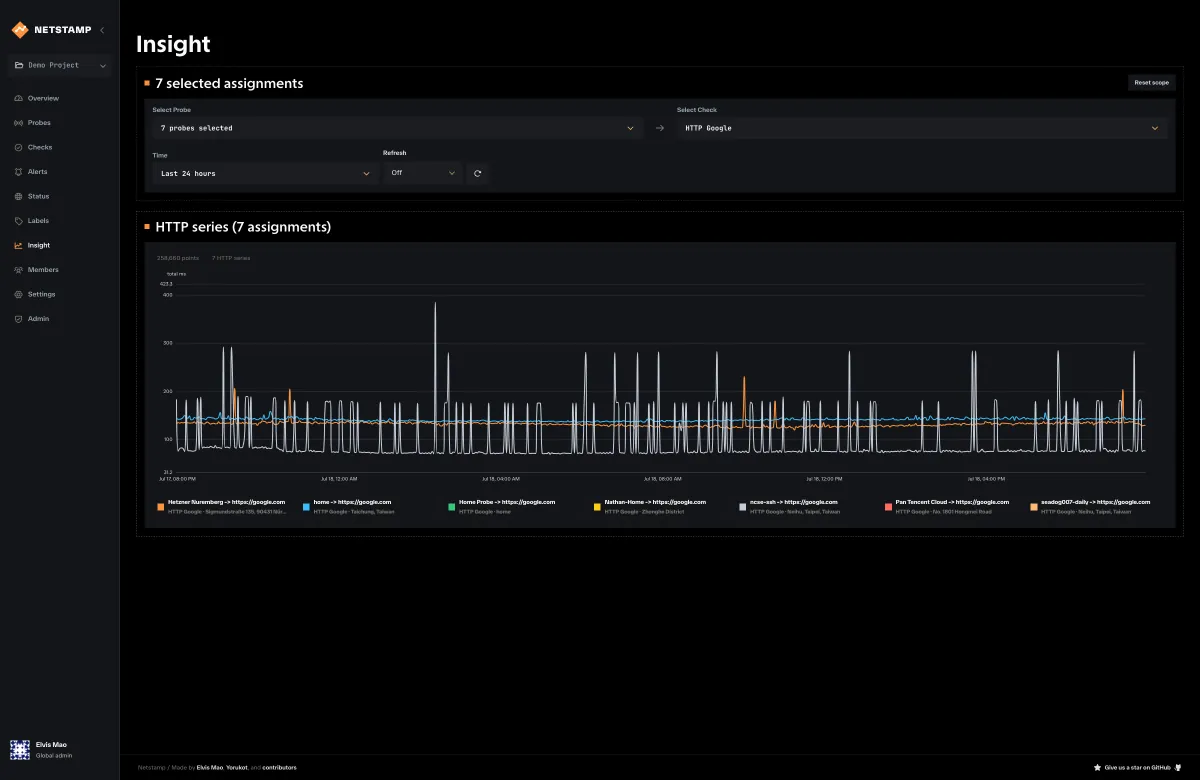
HTTP Insight separates:
- DNS duration;
- TCP connect duration;
- TLS handshake duration;
- time to first byte;
- total request duration;
- failure percentage.
Latest result details show status code, final URL, redirect count, body assertion result, response size, resolved address, TLS version/cipher, and certificate validity when available.
The certificate inventory aggregates observed HTTPS certificates and days remaining. Use an alert on http.certificate_days_remaining when expiration needs proactive notification.
Traceroute analysis
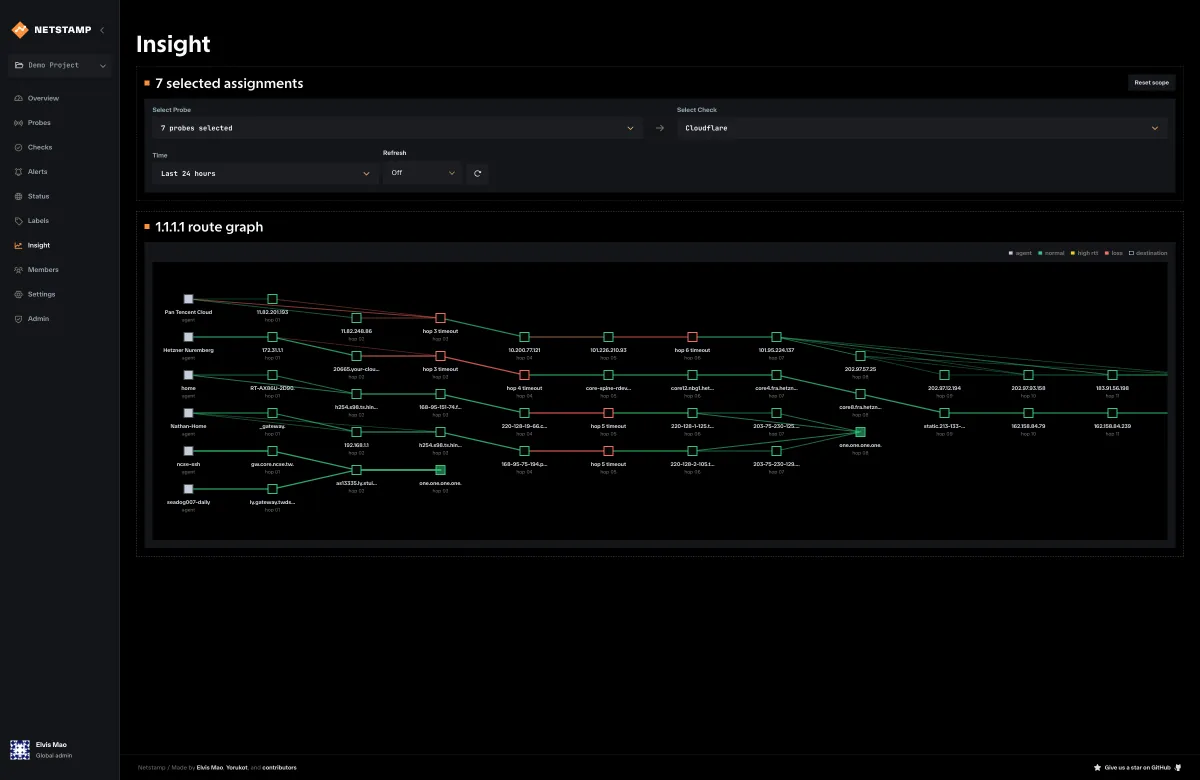
Traceroute offers sampled runs and a topology view. Compare route shape, hop latency, loss, destination reachability, and changes between probes.
Intermediate routers may rate-limit or ignore traceroute while forwarding traffic normally. Treat missing hop responses as path evidence, not proof of packet loss, unless endpoint measurements and multiple viewpoints support the conclusion.
Time range and resolution
The query API returns raw or aggregate series based on time range, requested point budget, and available continuous aggregates. Longer ranges trade per-execution detail for readable and efficient series.
For incident diagnosis:
- narrow to the incident window;
- compare affected and unaffected probes;
- correlate multiple metrics;
- inspect latest raw detail and traceroute runs;
- widen the range to establish the normal baseline.