
'%3e%3cpath%20d='m19.6%2066.5%2019.7-11%20.3-1-.3-.5h-1l-3.3-.2-11.2-.3L14%2053l-9.5-.5-2.4-.5L0%2049l.2-1.5%202-1.3%202.9.2%206.3.5%209.5.6%206.9.4L38%2049.1h1.6l.2-.7-.5-.4-.4-.4L29%2041l-10.6-7-5.6-4.1-3-2-1.5-2-.6-4.2%202.7-3%203.7.3.9.2%203.7%202.9%208%206.1L37%2036l1.5%201.2.6-.4.1-.3-.7-1.1L33%2025l-6-10.4-2.7-4.3-.7-2.6c-.3-1-.4-2-.4-3l3-4.2L28%200l4.2.6L33.8%202l2.6%206%204.1%209.3L47%2029.9l2%203.8%201%203.4.3%201h.7v-.5l.5-7.2%201-8.7%201-11.2.3-3.2%201.6-3.8%203-2L61%202.6l2%202.9-.3%201.8-1.1%207.7L59%2027.1l-1.5%208.2h.9l1-1.1%204.1-5.4%206.9-8.6%203-3.5L77%2013l2.3-1.8h4.3l3.1%204.7-1.4%204.9-4.4%205.6-3.7%204.7-5.3%207.1-3.2%205.7.3.4h.7l12-2.6%206.4-1.1%207.6-1.3%203.5%201.6.4%201.6-1.4%203.4-8.2%202-9.6%202-14.3%203.3-.2.1.2.3%206.4.6%202.8.2h6.8l12.6%201%203.3%202%201.9%202.7-.3%202-5.1%202.6-6.8-1.6-16-3.8-5.4-1.3h-.8v.4l4.6%204.5%208.3%207.5L89%2080.1l.5%202.4-1.3%202-1.4-.2-9.2-7-3.6-3-8-6.8h-.5v.7l1.8%202.7%209.8%2014.7.5%204.5-.7%201.4-2.6%201-2.7-.6-5.8-8-6-9-4.7-8.2-.5.4-2.9%2030.2-1.3%201.5-3%201.2-2.5-2-1.4-3%201.4-6.2%201.6-8%201.3-6.4%201.2-7.9.7-2.6v-.2H49L43%2072l-9%2012.3-7.2%207.6-1.7.7-3-1.5.3-2.8L24%2086l10-12.8%206-7.9%204-4.6-.1-.5h-.3L17.2%2077.4l-4.7.6-2-2%20.2-3%201-1%208-5.5Z'/%3e%3c/svg%3e)
This guide shows you how to start a local Netstamp controller and database, create the first administrator and project, install a Linux probe, and collect a Ping measurement.
By the end, you will have:
- Netstamp running at
http://localhost:3000 - One online probe
- A check assigned to that probe
- A result you can inspect in Insight
Prerequisites
- Docker Engine with Docker Compose v2
- A browser
- OpenSSL for generating secrets
- A Linux amd64 or arm64 host for the probe
curlorwget,sudo, and systemd on the probe host
For an evaluation, the controller and probe can run on the same Linux machine. A probe on another machine or network provides a more useful monitoring viewpoint.
1. Download Netstamp
Create a directory and download the deployment files attached to the latest Netstamp release:
mkdir netstamp
cd netstamp
curl -fsSLO https://github.com/yorukot/netstamp/releases/latest/download/compose.yaml
curl -fsSLO https://github.com/yorukot/netstamp/releases/latest/download/env.example
cp env.example .env
chmod 600 .env
2. Configure the required secrets
Generate five independent values:
openssl rand -hex 32
openssl rand -hex 32
openssl rand -hex 32
openssl rand -hex 32
openssl rand -hex 32
Open .env and put a different generated value in each required field:
DATABASE_PASSWORD=<random value>
LOG_PSEUDONYM_KEY=<random value>
SYSTEM_SETTINGS_ENCRYPTION_KEY=<random value>
AUTH_SESSION_HASH_KEY=<random value>
AUTH_API_TOKEN_HASH_KEY=<random value>
Keep these values stable across restarts and upgrades. Changing them can invalidate credentials or make encrypted settings unreadable.
3. Start Netstamp
Pull the images and start the stack:
docker compose pull
docker compose up -d
docker compose ps
The expected state is:
postgresis healthy;migrateexited with status0; andnetstampis running.
Verify the application and API health endpoints:
curl --fail http://localhost:3000/healthz
curl --fail http://localhost:3000/api/v1/healthz
Both commands should complete successfully. If a service is not ready, inspect it with docker compose logs <service>.
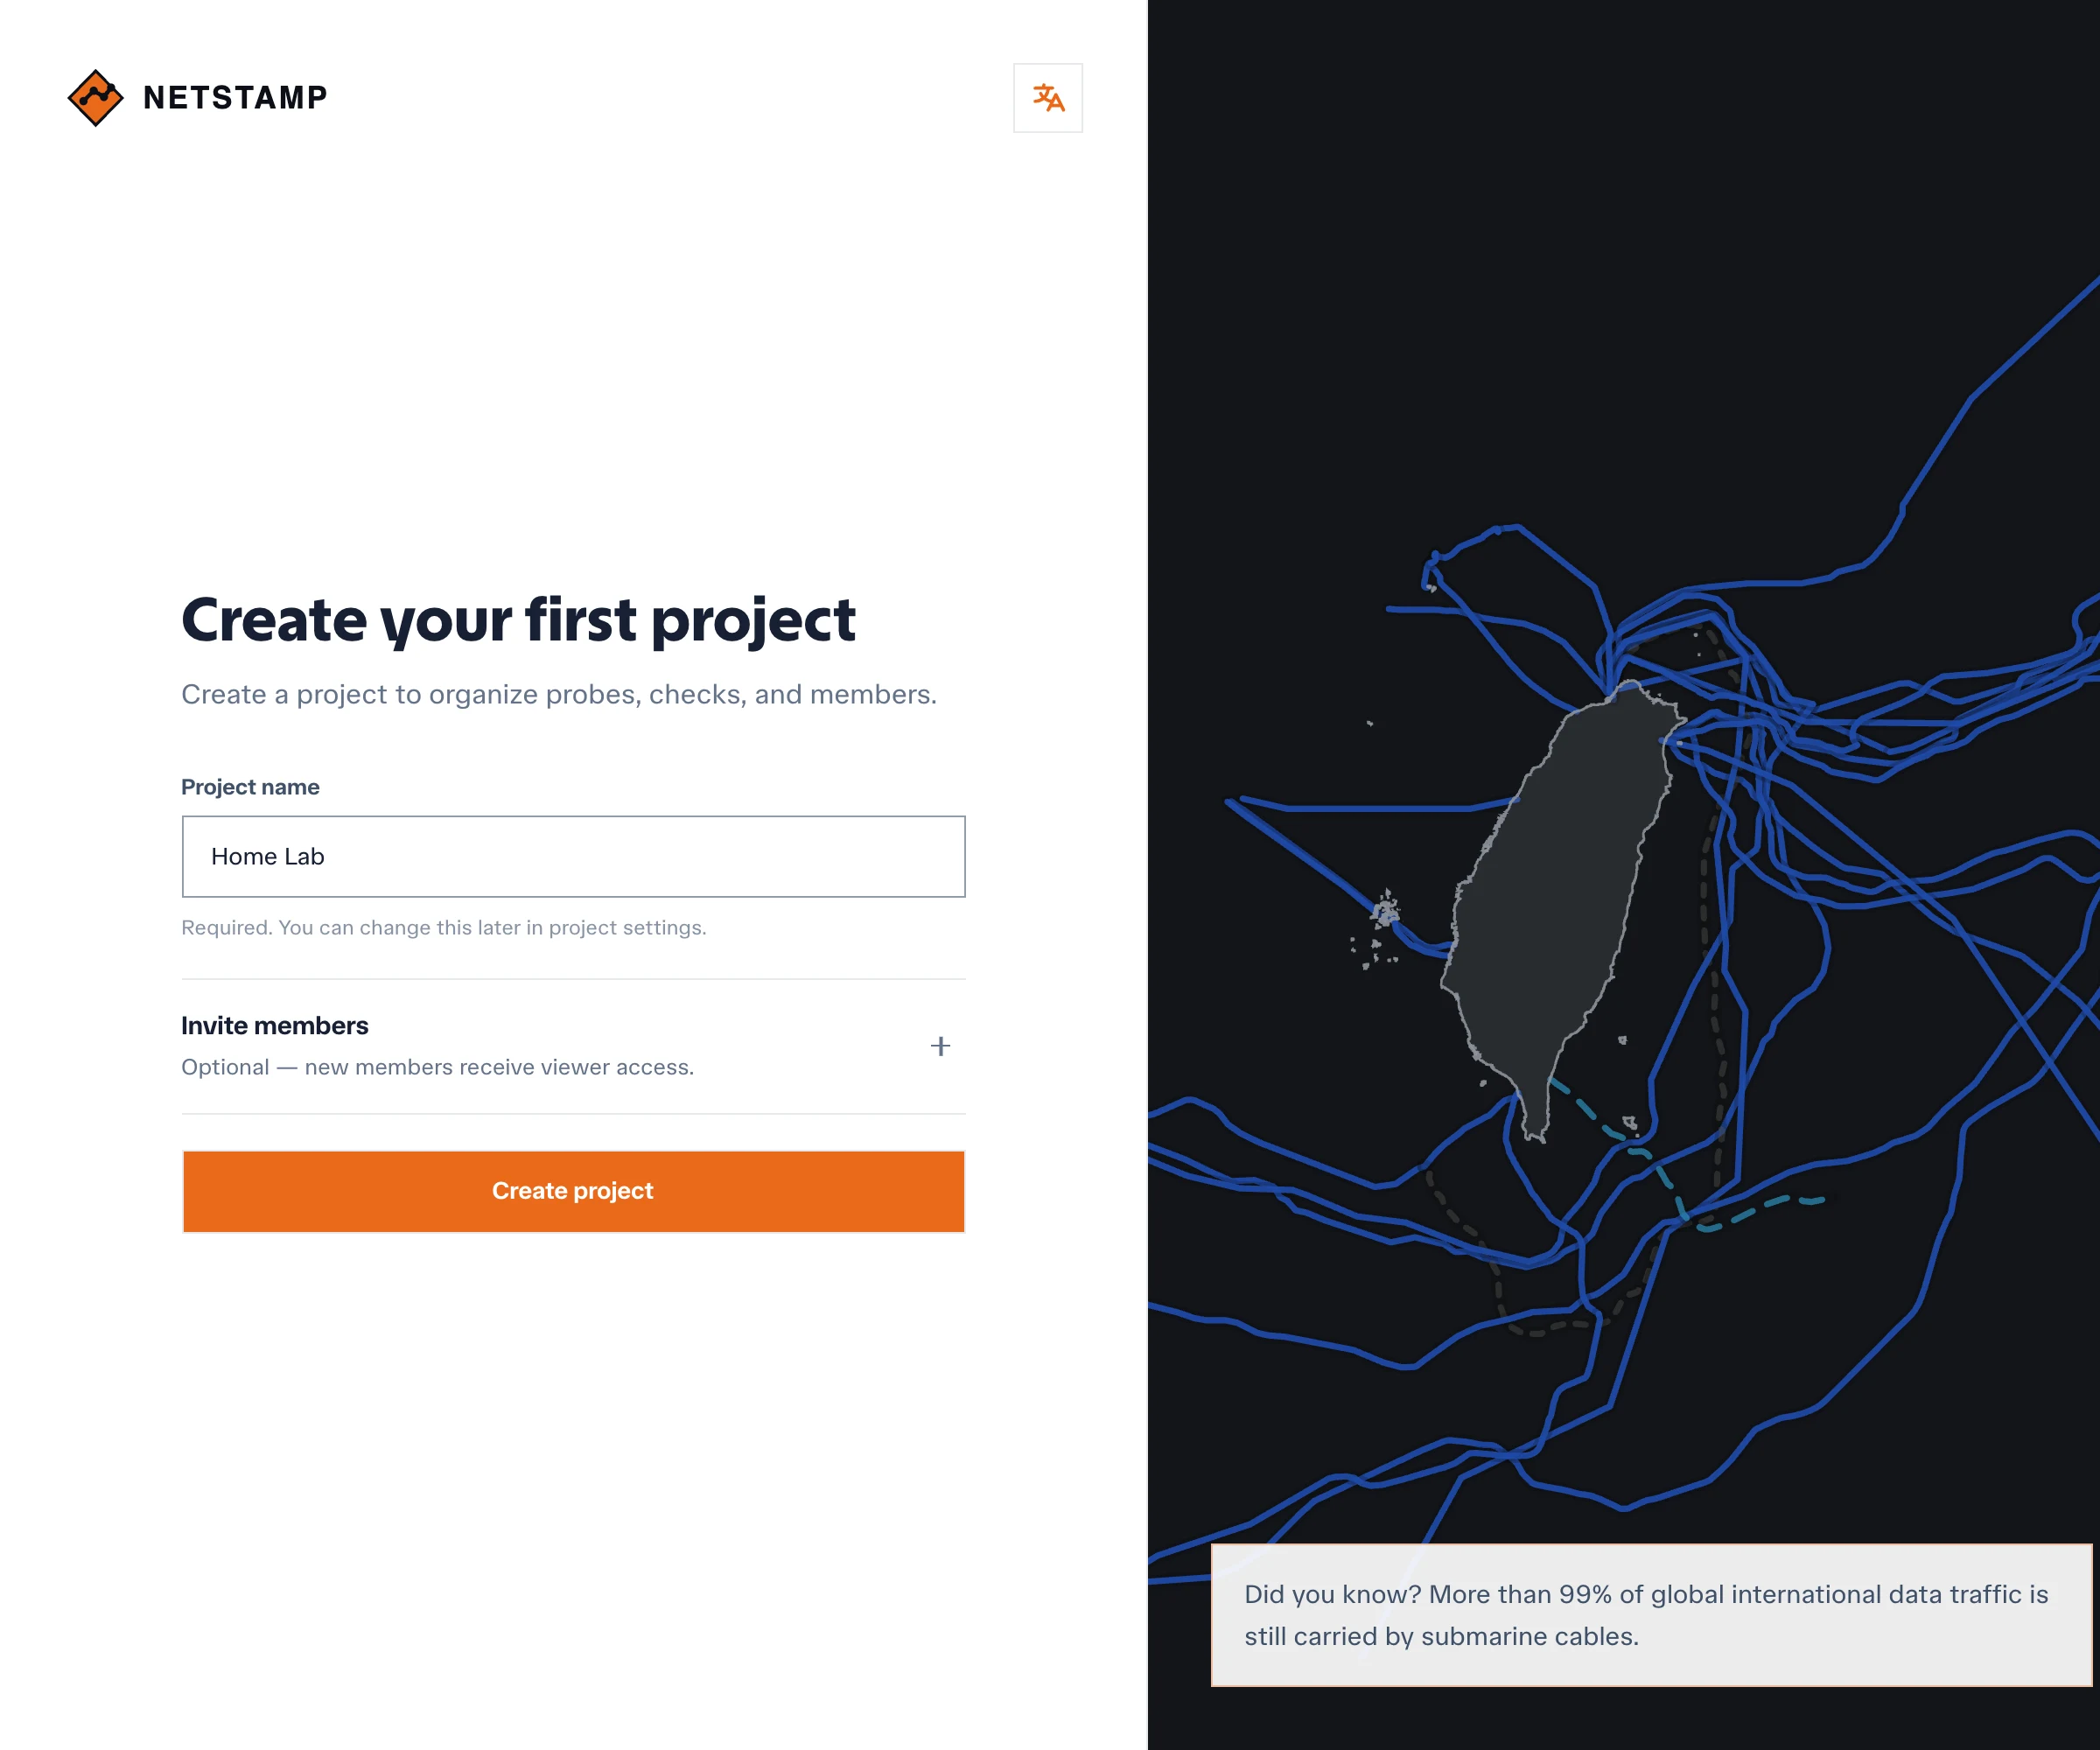
4. Create the first account and project
Open Netstamp in a browser, then:
- Select Sign up and create an account.
- Enter a name for your first project, such as
Home Lab. - Select Create project.
The first account registered on a new installation automatically becomes a system administrator. Netstamp generates a URL-safe project slug from the project name.
5. Install a probe
- Open Probes and select New probe.
- Enter a stable name, such as
taipei-home-01. - Search for its location, or select Manual coordinates and enter latitude and longitude.
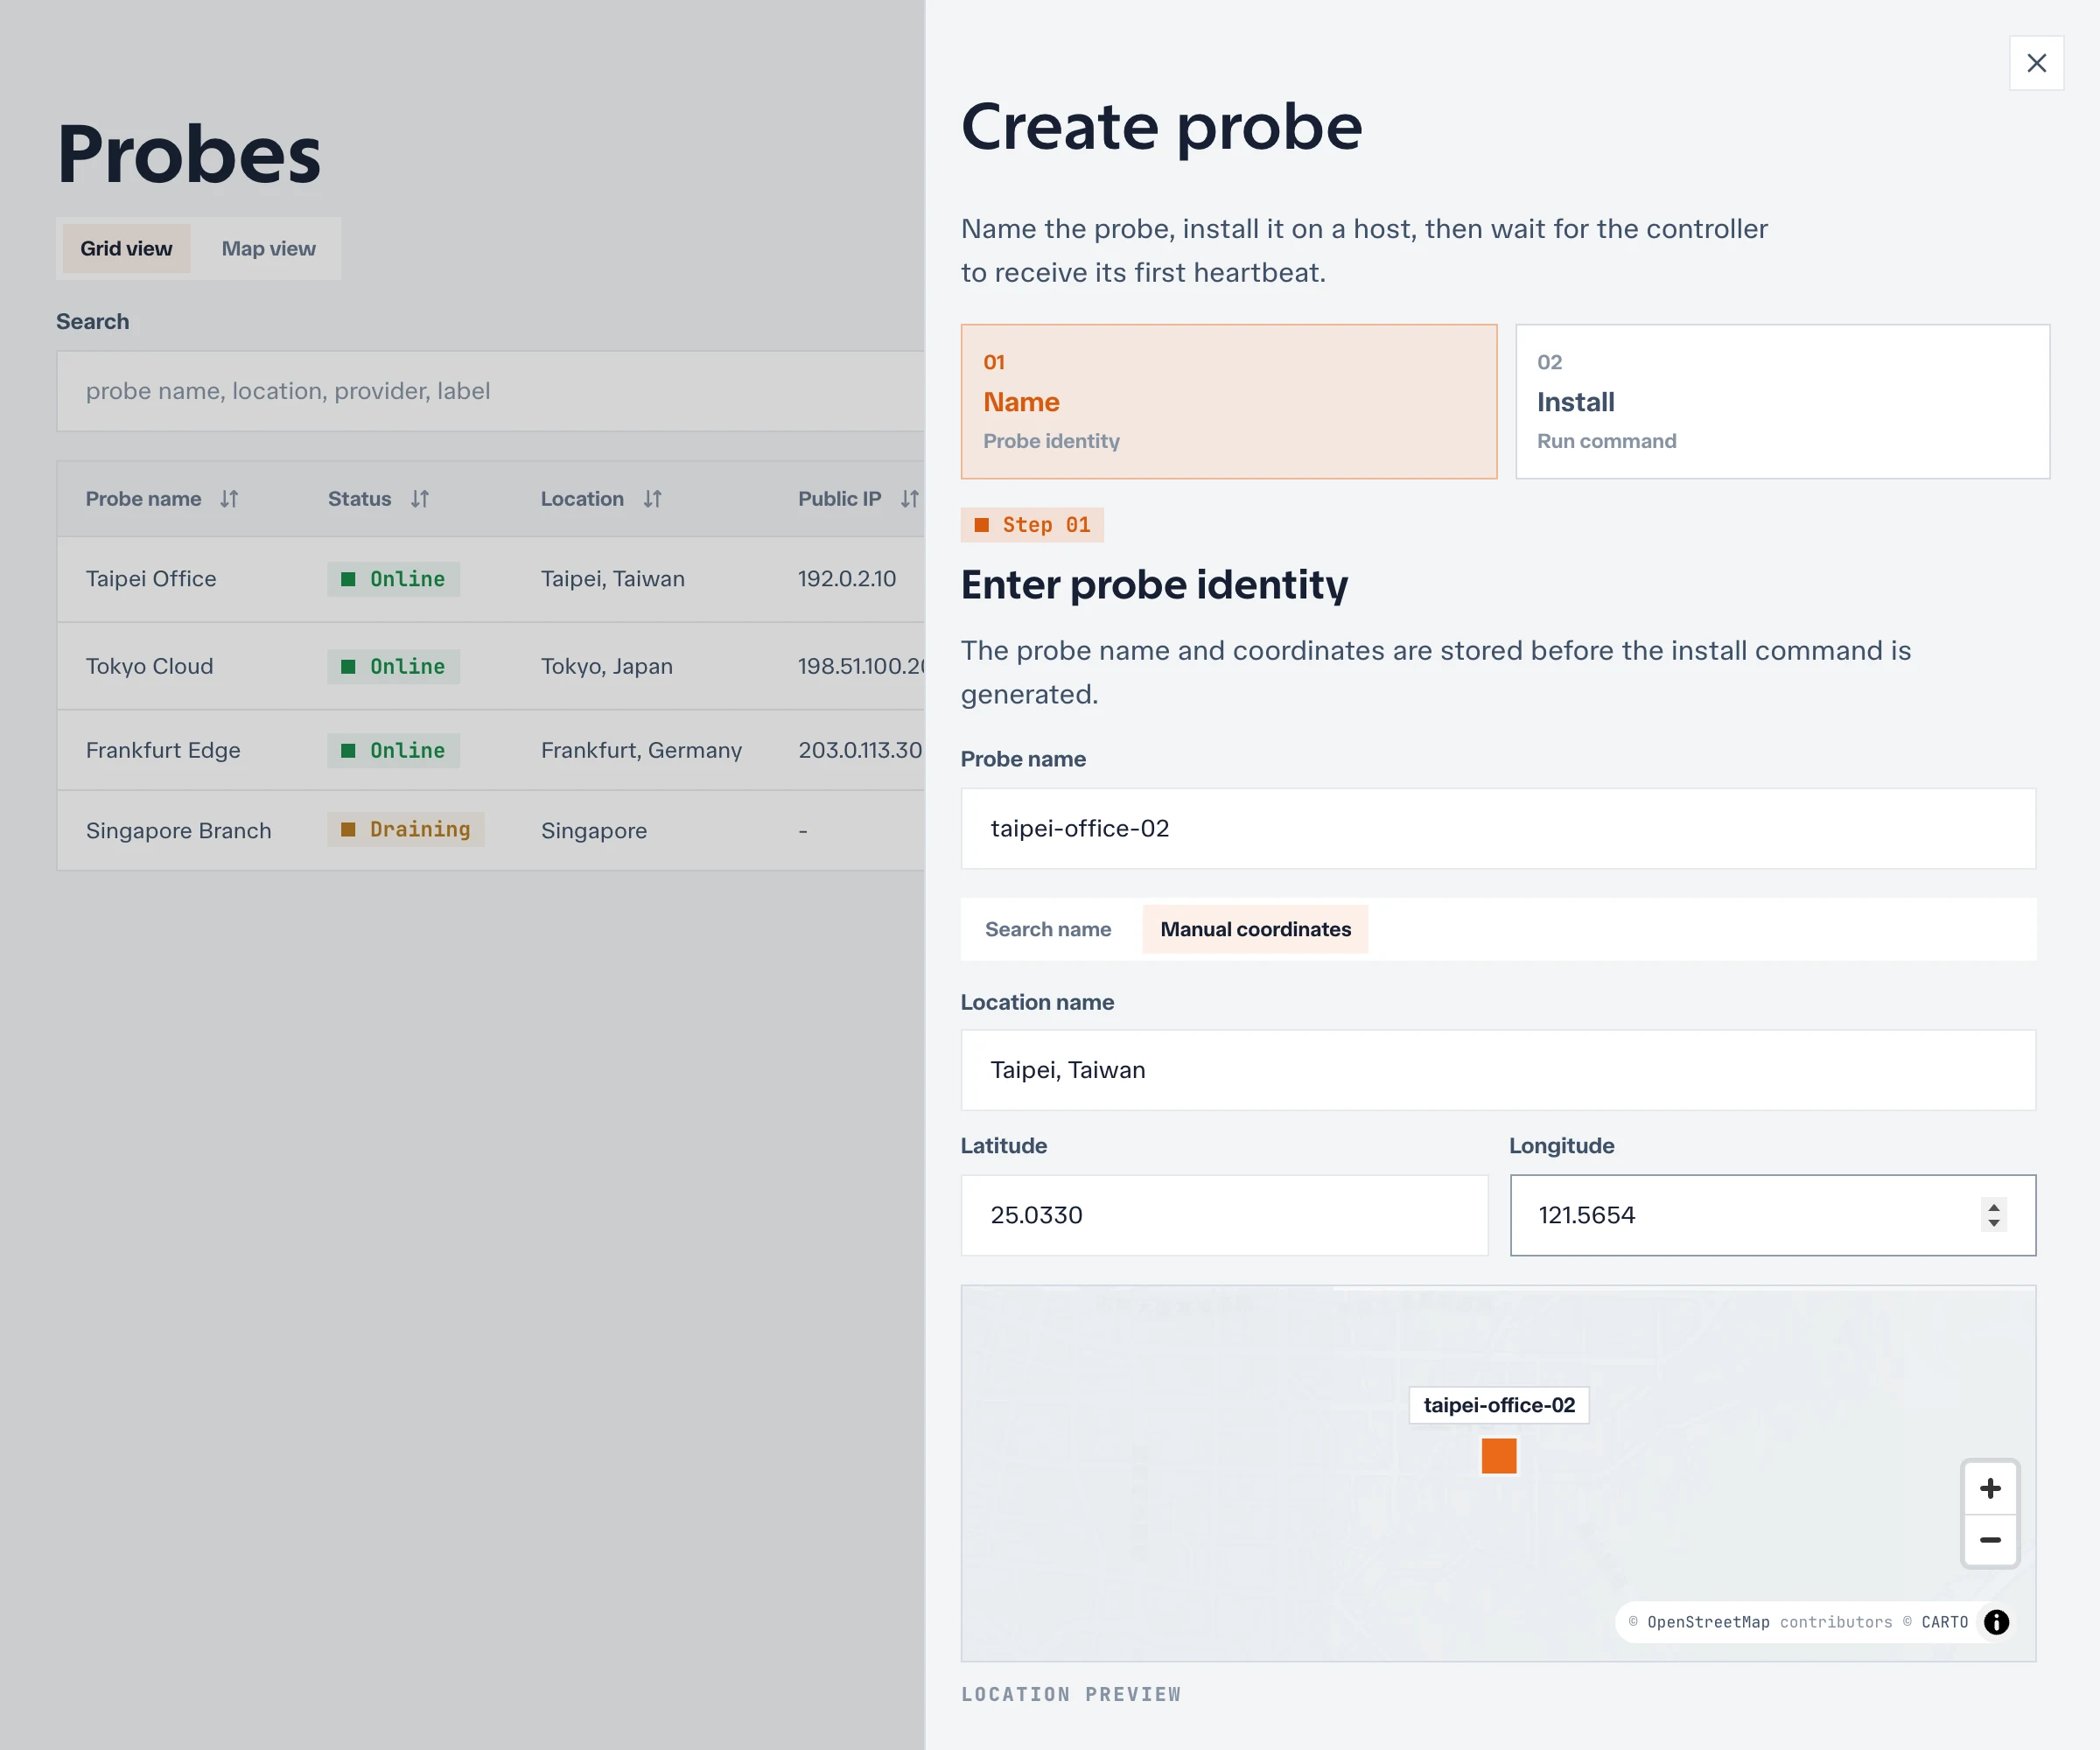
- Select Continue to install.
- Copy the generated install command and run it on the Linux probe host.
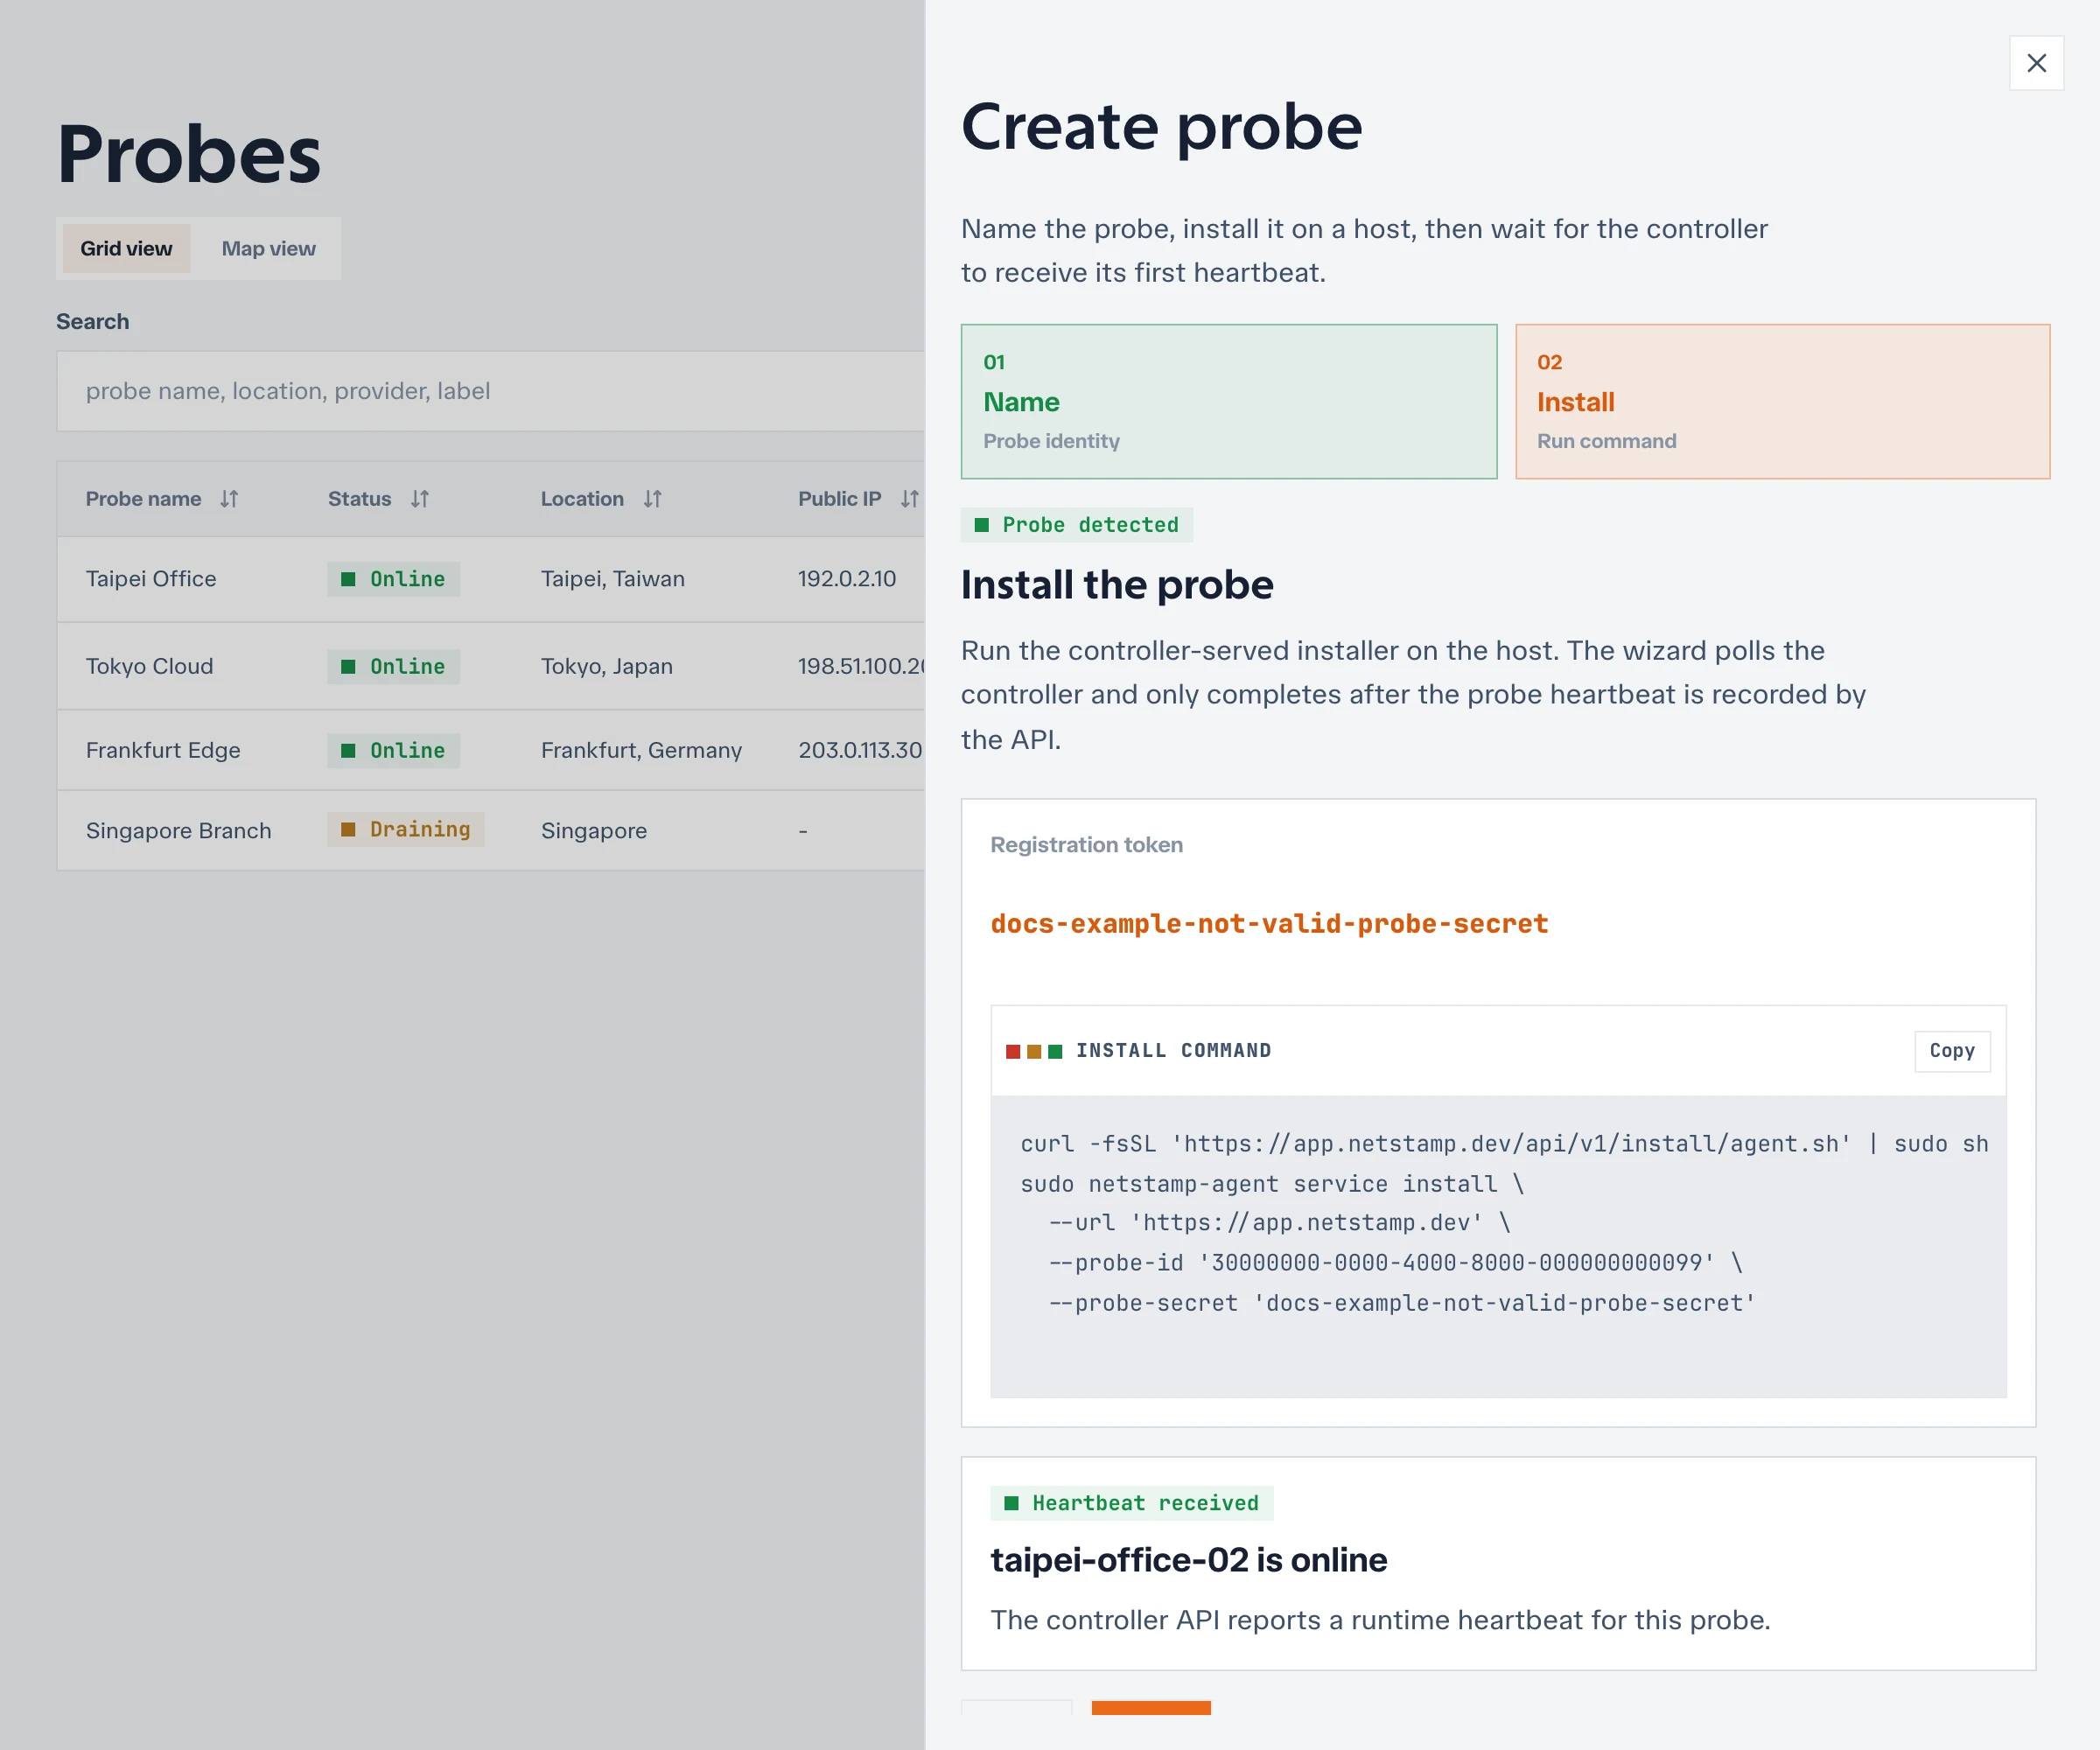
- Wait for the wizard to show Heartbeat received, then select Finish.
The command downloads the correct amd64 or arm64 agent from your controller, stores the probe credential in a root-owned environment file, and installs a systemd service.
6. Create a check
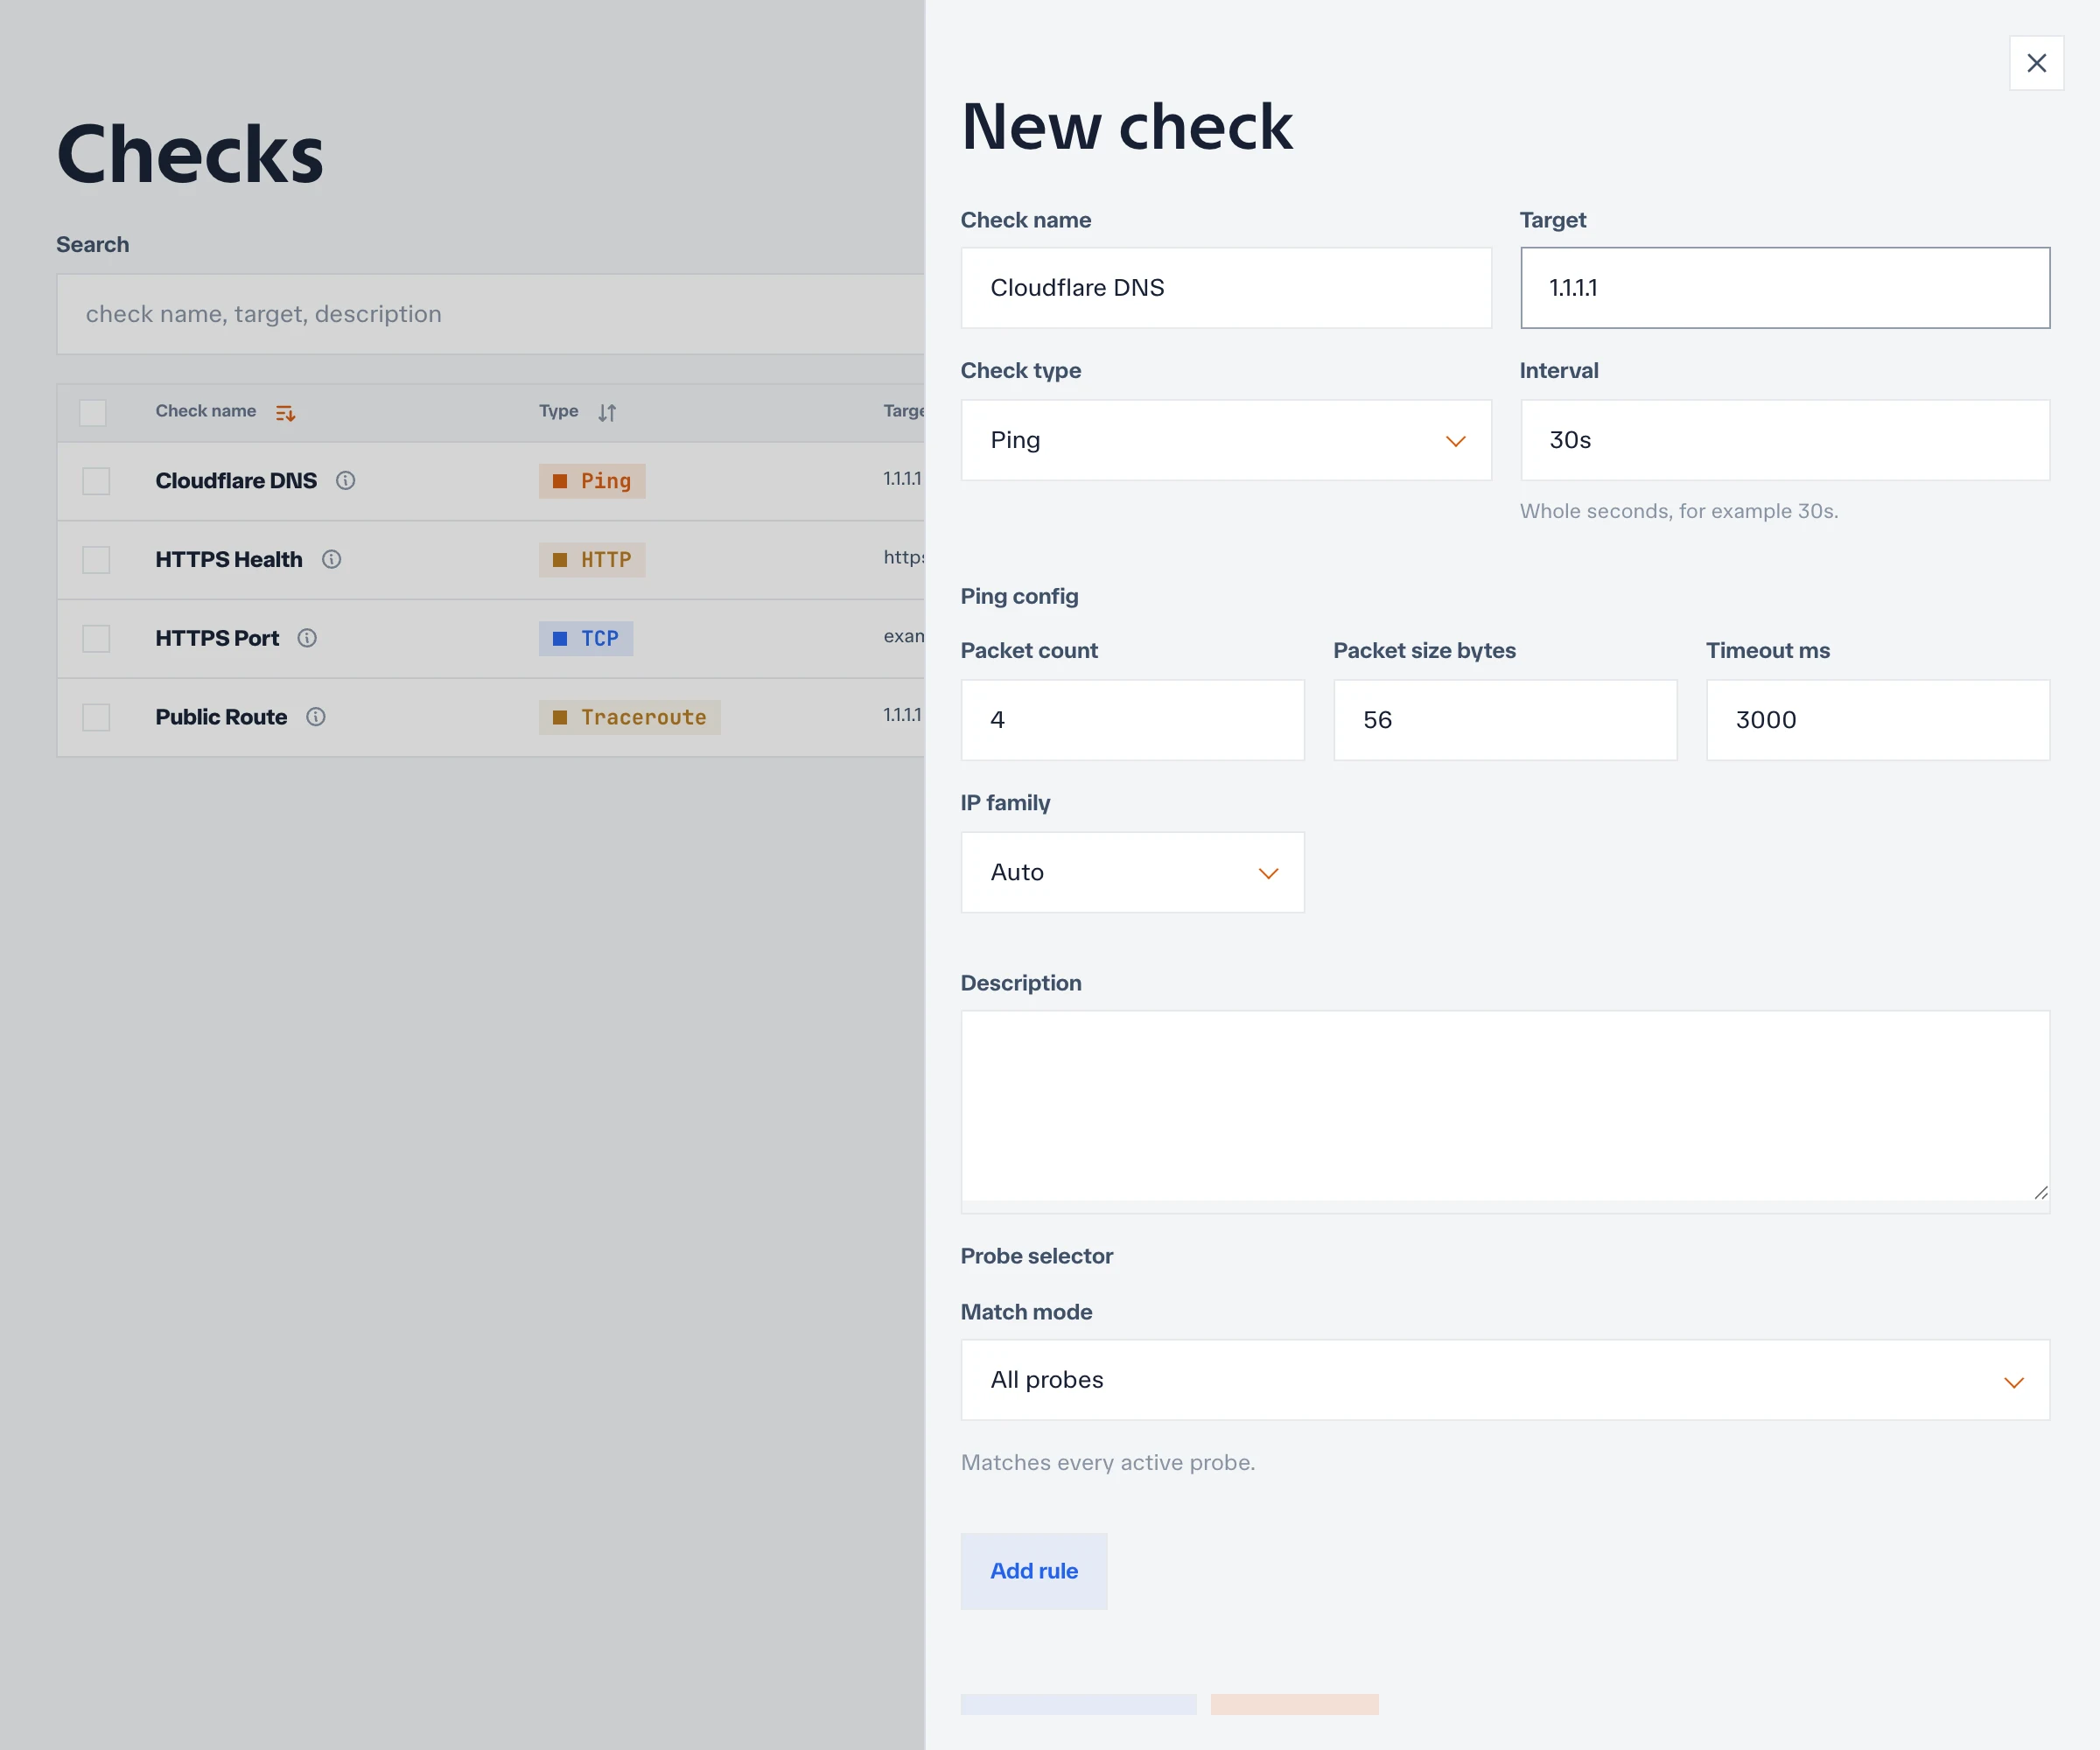
- Open Checks and select New check.
- Enter
cloudflare-dnsfor the check name. - Enter
1.1.1.1for the target. - Select Ping and set the interval to
30s. - Leave Probe selector set to All probes.
- Select Create check.
Netstamp assigns the check to every enabled probe that matches the selector. The new probe receives the assignment on its next refresh.
7. Verify the first result
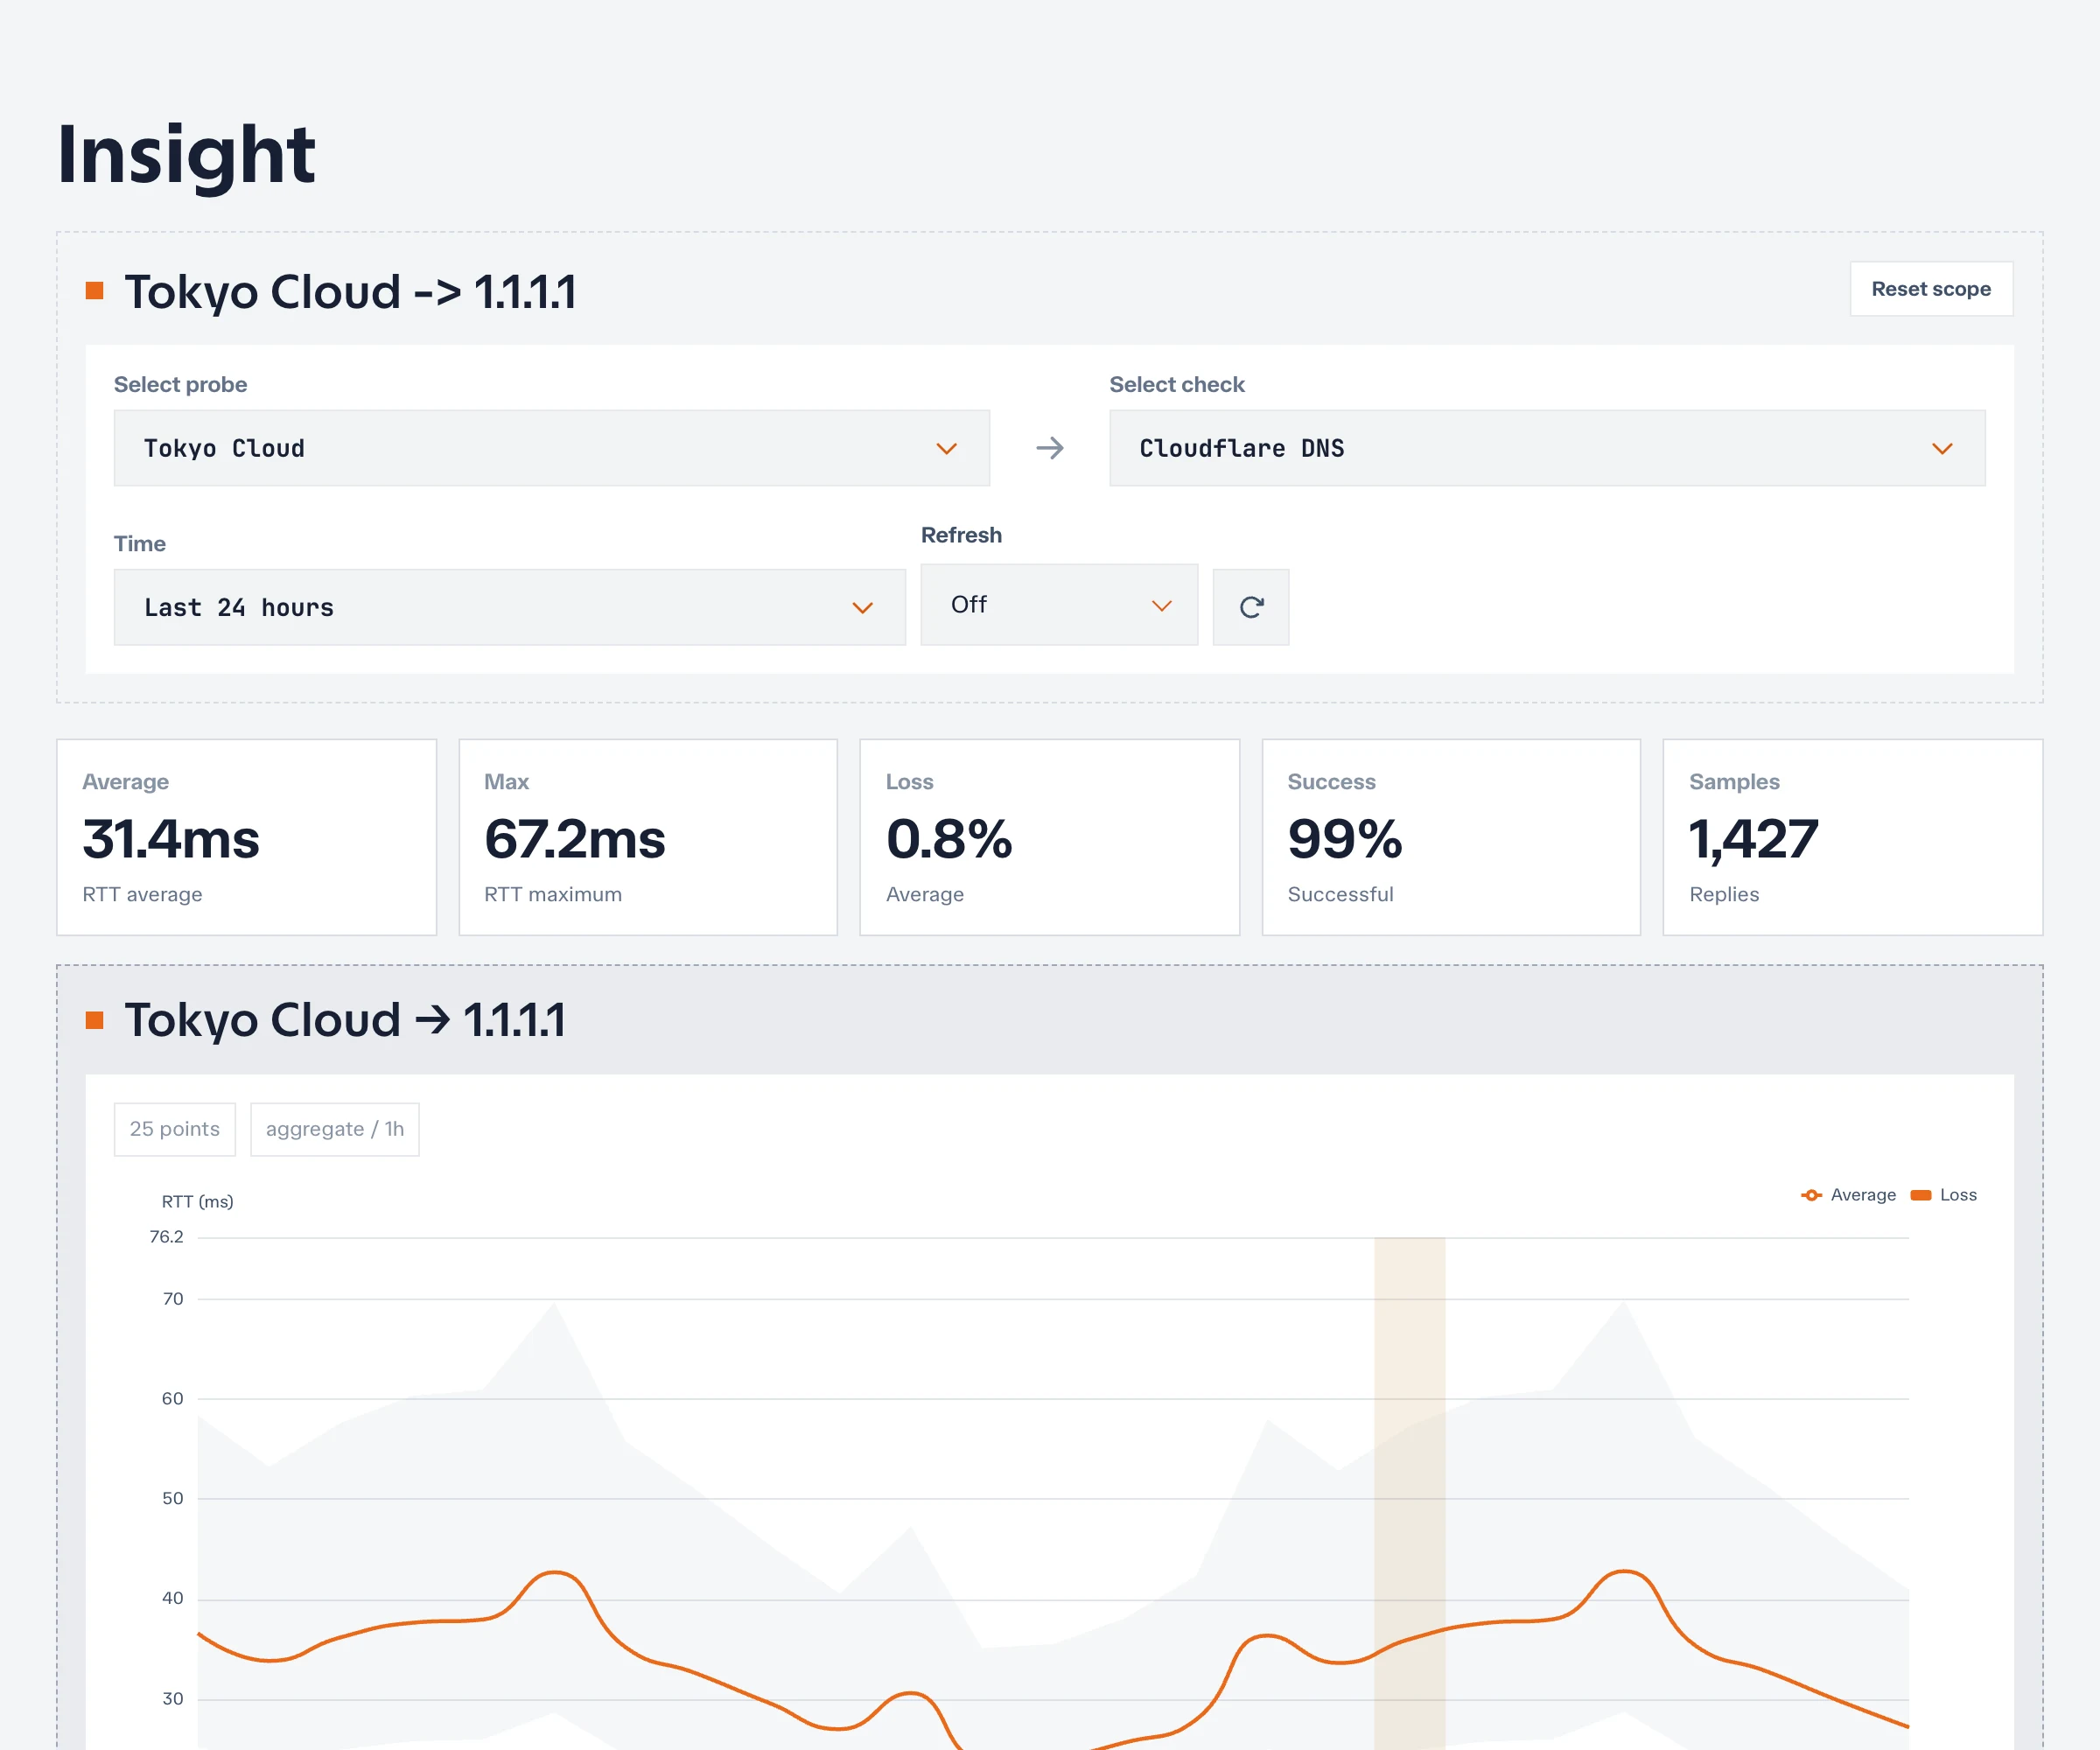
Open Insight, select the cloudflare-dns check and your probe, then wait for the first interval to complete. A successful Ping result shows latency and packet-loss measurements from that probe’s network viewpoint.
If the probe network blocks outbound ICMP, the result can report a timeout or error. That result still confirms that the assignment and reporting path are working; use another reachable IP address if you need a successful Ping measurement.
You now have a working Netstamp installation that collects measurements from a probe you control.
Next steps
- Learn how controllers, projects, probes, checks, and assignments relate in Core concepts.
- Prepare a persistent, publicly reachable deployment with the Installation overview.
- Explore every supported check type in Checks.
- Add incident detection and delivery in Alerts and incidents.