
'%3e%3cpath%20d='m19.6%2066.5%2019.7-11%20.3-1-.3-.5h-1l-3.3-.2-11.2-.3L14%2053l-9.5-.5-2.4-.5L0%2049l.2-1.5%202-1.3%202.9.2%206.3.5%209.5.6%206.9.4L38%2049.1h1.6l.2-.7-.5-.4-.4-.4L29%2041l-10.6-7-5.6-4.1-3-2-1.5-2-.6-4.2%202.7-3%203.7.3.9.2%203.7%202.9%208%206.1L37%2036l1.5%201.2.6-.4.1-.3-.7-1.1L33%2025l-6-10.4-2.7-4.3-.7-2.6c-.3-1-.4-2-.4-3l3-4.2L28%200l4.2.6L33.8%202l2.6%206%204.1%209.3L47%2029.9l2%203.8%201%203.4.3%201h.7v-.5l.5-7.2%201-8.7%201-11.2.3-3.2%201.6-3.8%203-2L61%202.6l2%202.9-.3%201.8-1.1%207.7L59%2027.1l-1.5%208.2h.9l1-1.1%204.1-5.4%206.9-8.6%203-3.5L77%2013l2.3-1.8h4.3l3.1%204.7-1.4%204.9-4.4%205.6-3.7%204.7-5.3%207.1-3.2%205.7.3.4h.7l12-2.6%206.4-1.1%207.6-1.3%203.5%201.6.4%201.6-1.4%203.4-8.2%202-9.6%202-14.3%203.3-.2.1.2.3%206.4.6%202.8.2h6.8l12.6%201%203.3%202%201.9%202.7-.3%202-5.1%202.6-6.8-1.6-16-3.8-5.4-1.3h-.8v.4l4.6%204.5%208.3%207.5L89%2080.1l.5%202.4-1.3%202-1.4-.2-9.2-7-3.6-3-8-6.8h-.5v.7l1.8%202.7%209.8%2014.7.5%204.5-.7%201.4-2.6%201-2.7-.6-5.8-8-6-9-4.7-8.2-.5.4-2.9%2030.2-1.3%201.5-3%201.2-2.5-2-1.4-3%201.4-6.2%201.6-8%201.3-6.4%201.2-7.9.7-2.6v-.2H49L43%2072l-9%2012.3-7.2%207.6-1.7.7-3-1.5.3-2.8L24%2086l10-12.8%206-7.9%204-4.6-.1-.5h-.3L17.2%2077.4l-4.7.6-2-2%20.2-3%201-1%208-5.5Z'/%3e%3c/svg%3e)
Insight turns measurements returned by probes into summaries, time series, certificate evidence, and route diagnostics. Use the project overview for a quick health scan. Use Insight when you need to answer a specific question and preserve the scope of an investigation.
This guide explains the controls shared by every Insight view. Continue with Ping, TCP, and HTTP analysis or Traceroute investigations when you are ready to interpret the results.
Build the scope
An Insight scope is the set of active probe–check assignments that matches your selection:
Selected probes × selected checks × active assignments = displayed results
The two selectors are filters, not independent queries. Netstamp only displays pairs that have an active assignment.
1. Select probes
Open Select probe and choose one or more probes. You can browse by individual probe or select every probe carrying a label such as region:tw or provider:cloud.
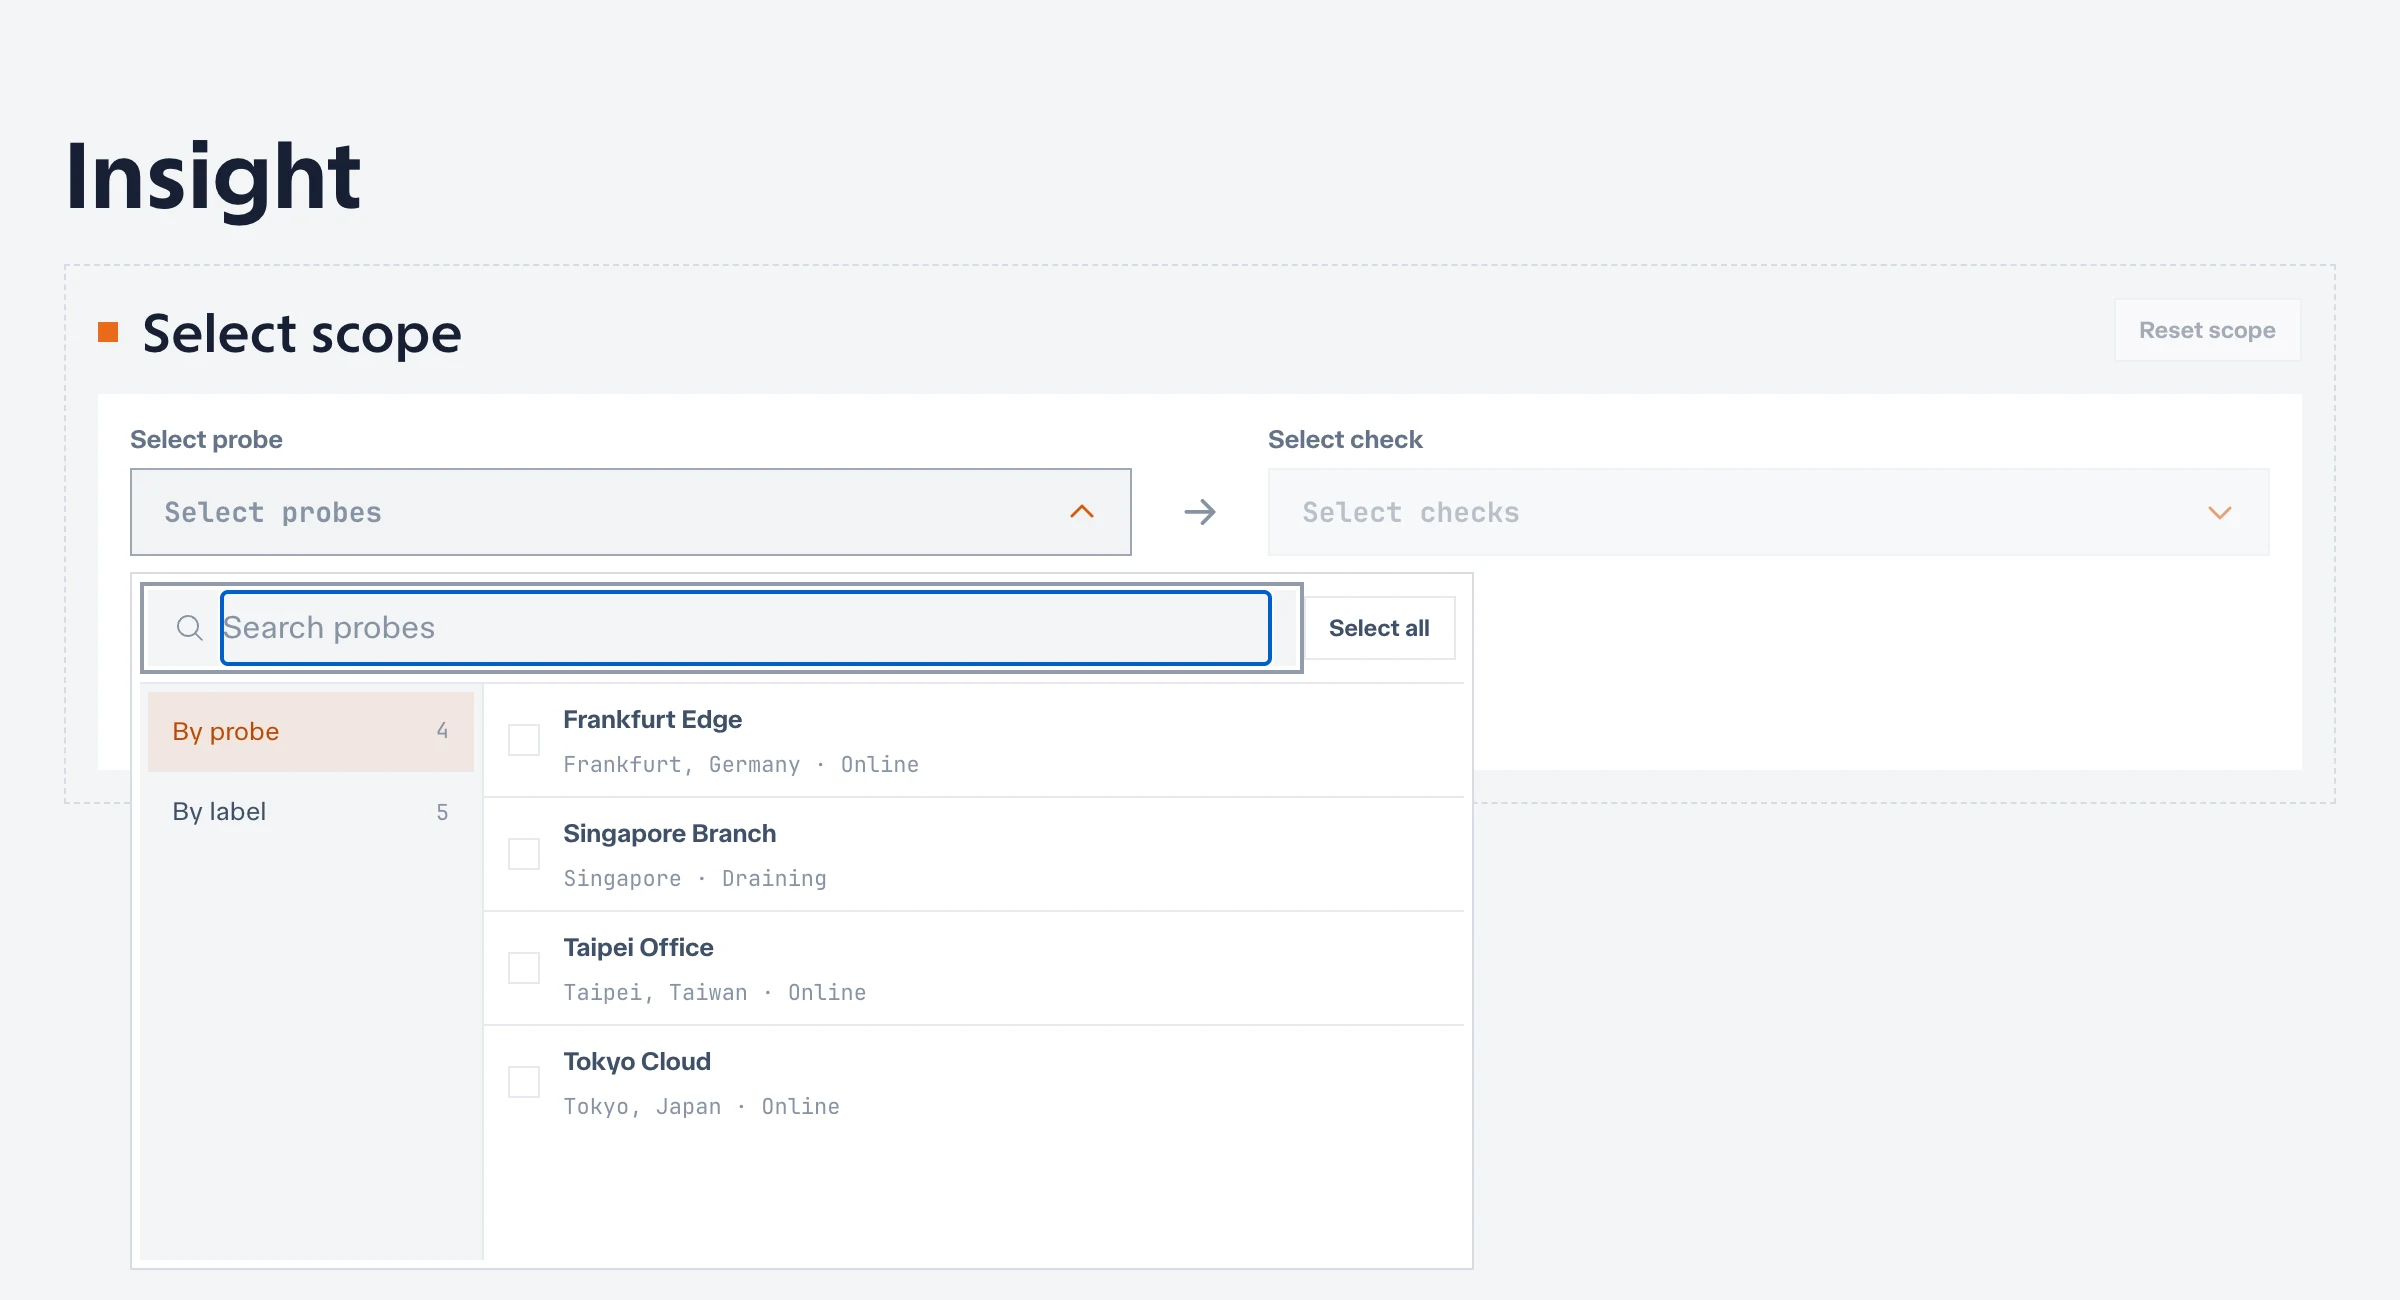
The selected probe scope controls which checks are available next. If you replace the probe selection, Netstamp removes any selected check that no longer has an active assignment in that scope.
2. Select checks
After selecting a probe, open Select check. Browse all matching checks or narrow the list by Ping, TCP, Traceroute, or HTTP/HTTPS.
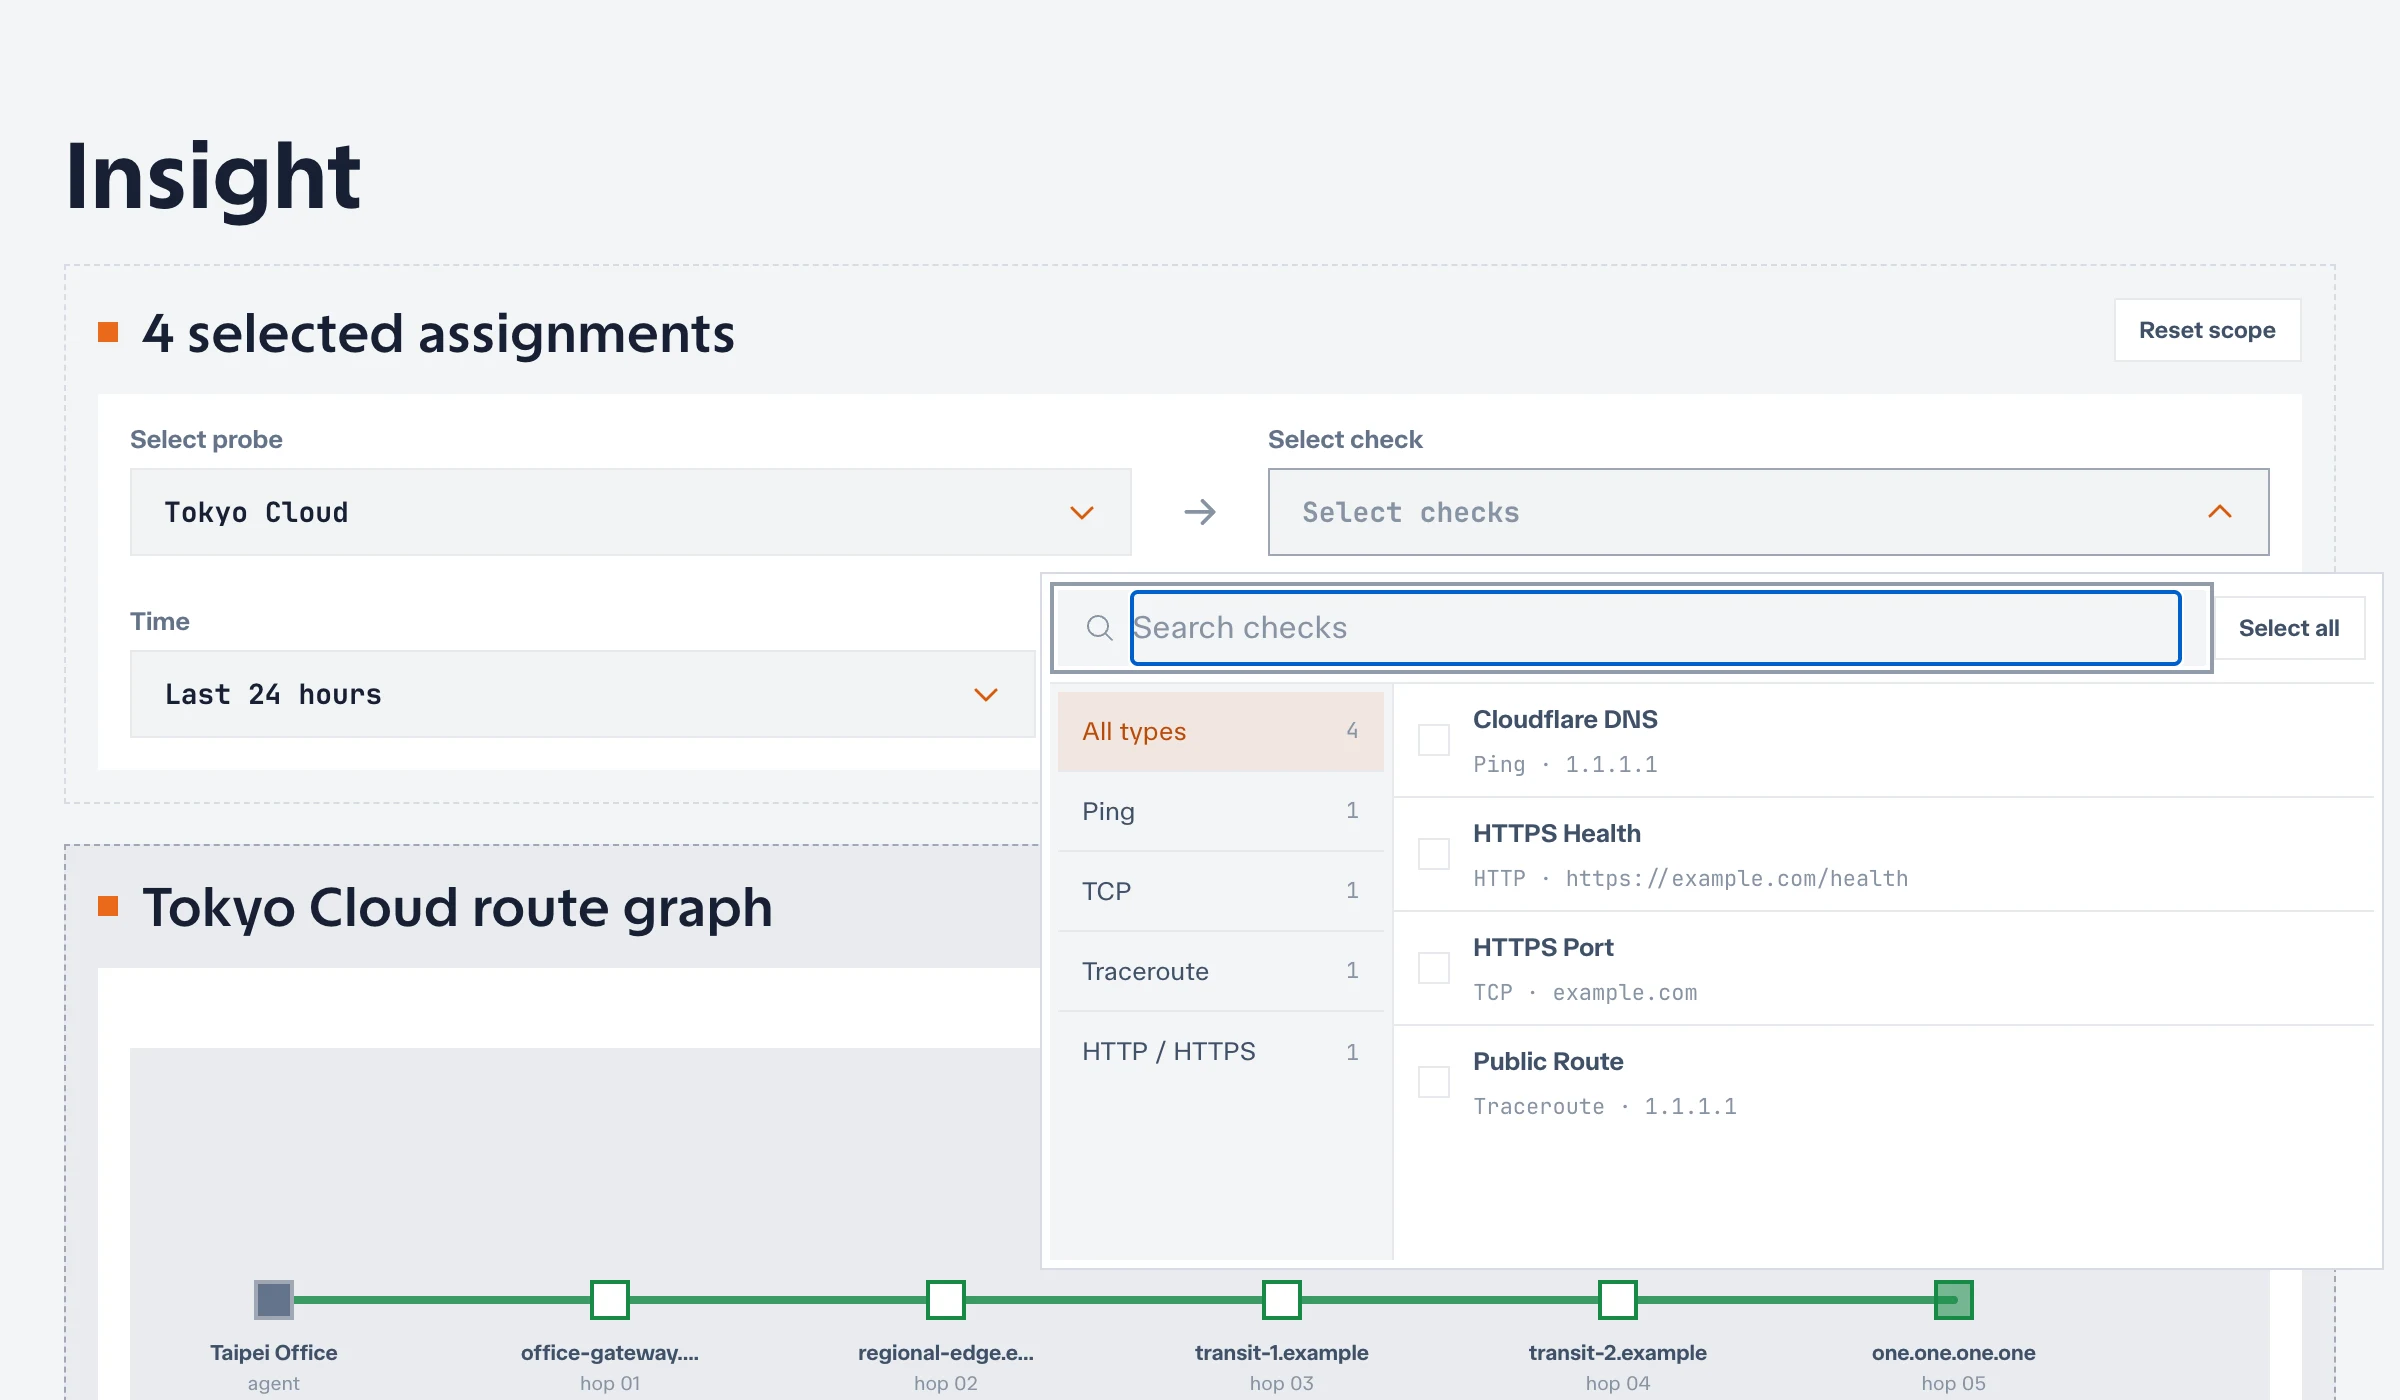
You do not always need both sides of the scope:
| Selection | Result |
|---|---|
| One probe and one check | Detailed view for one exact assignment |
| Multiple probes and one check | Compare the same check from several networks |
| One probe and multiple checks | Compare different checks from one network |
| Multiple probes and checks | One series per matching active assignment, separated by check type |
To compare one check across every assigned probe, select the check and then clear the probe selection without using Reset scope. The retained check becomes the only filter.
3. Confirm the resolved scope
The panel title shows either the exact probe-to-target path or the number of selected assignments. Confirm this title before interpreting or sharing a chart.
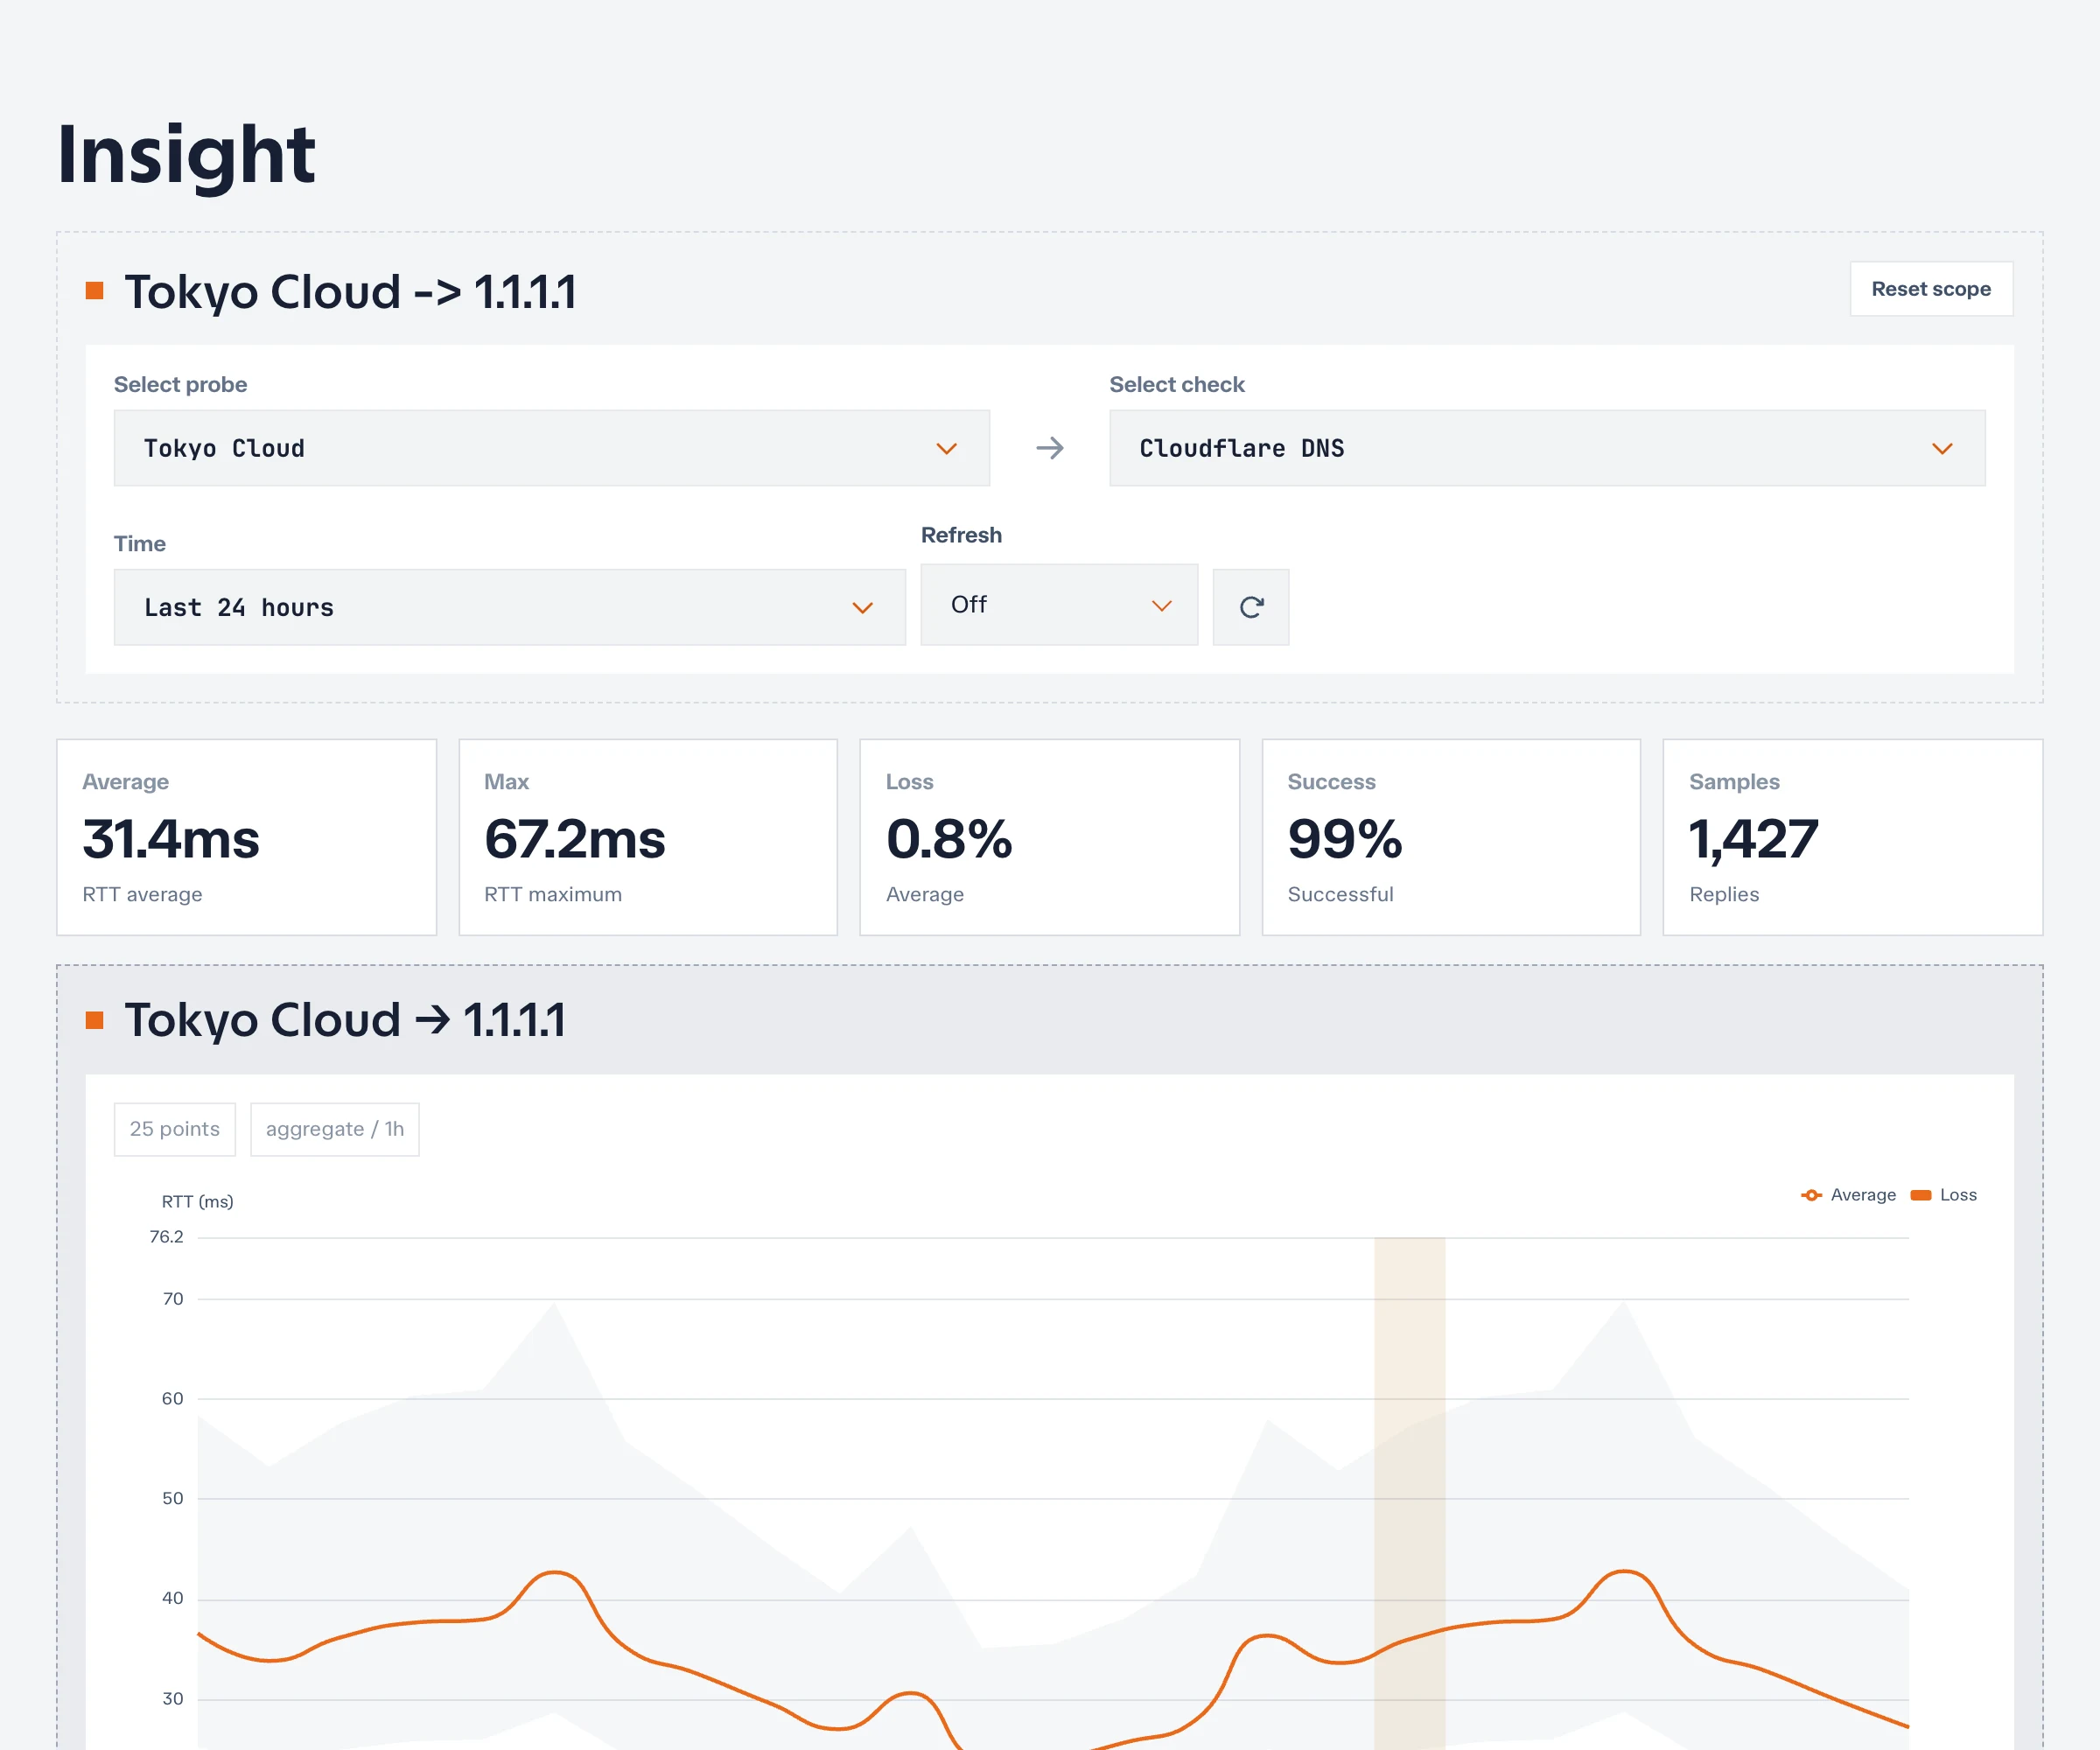
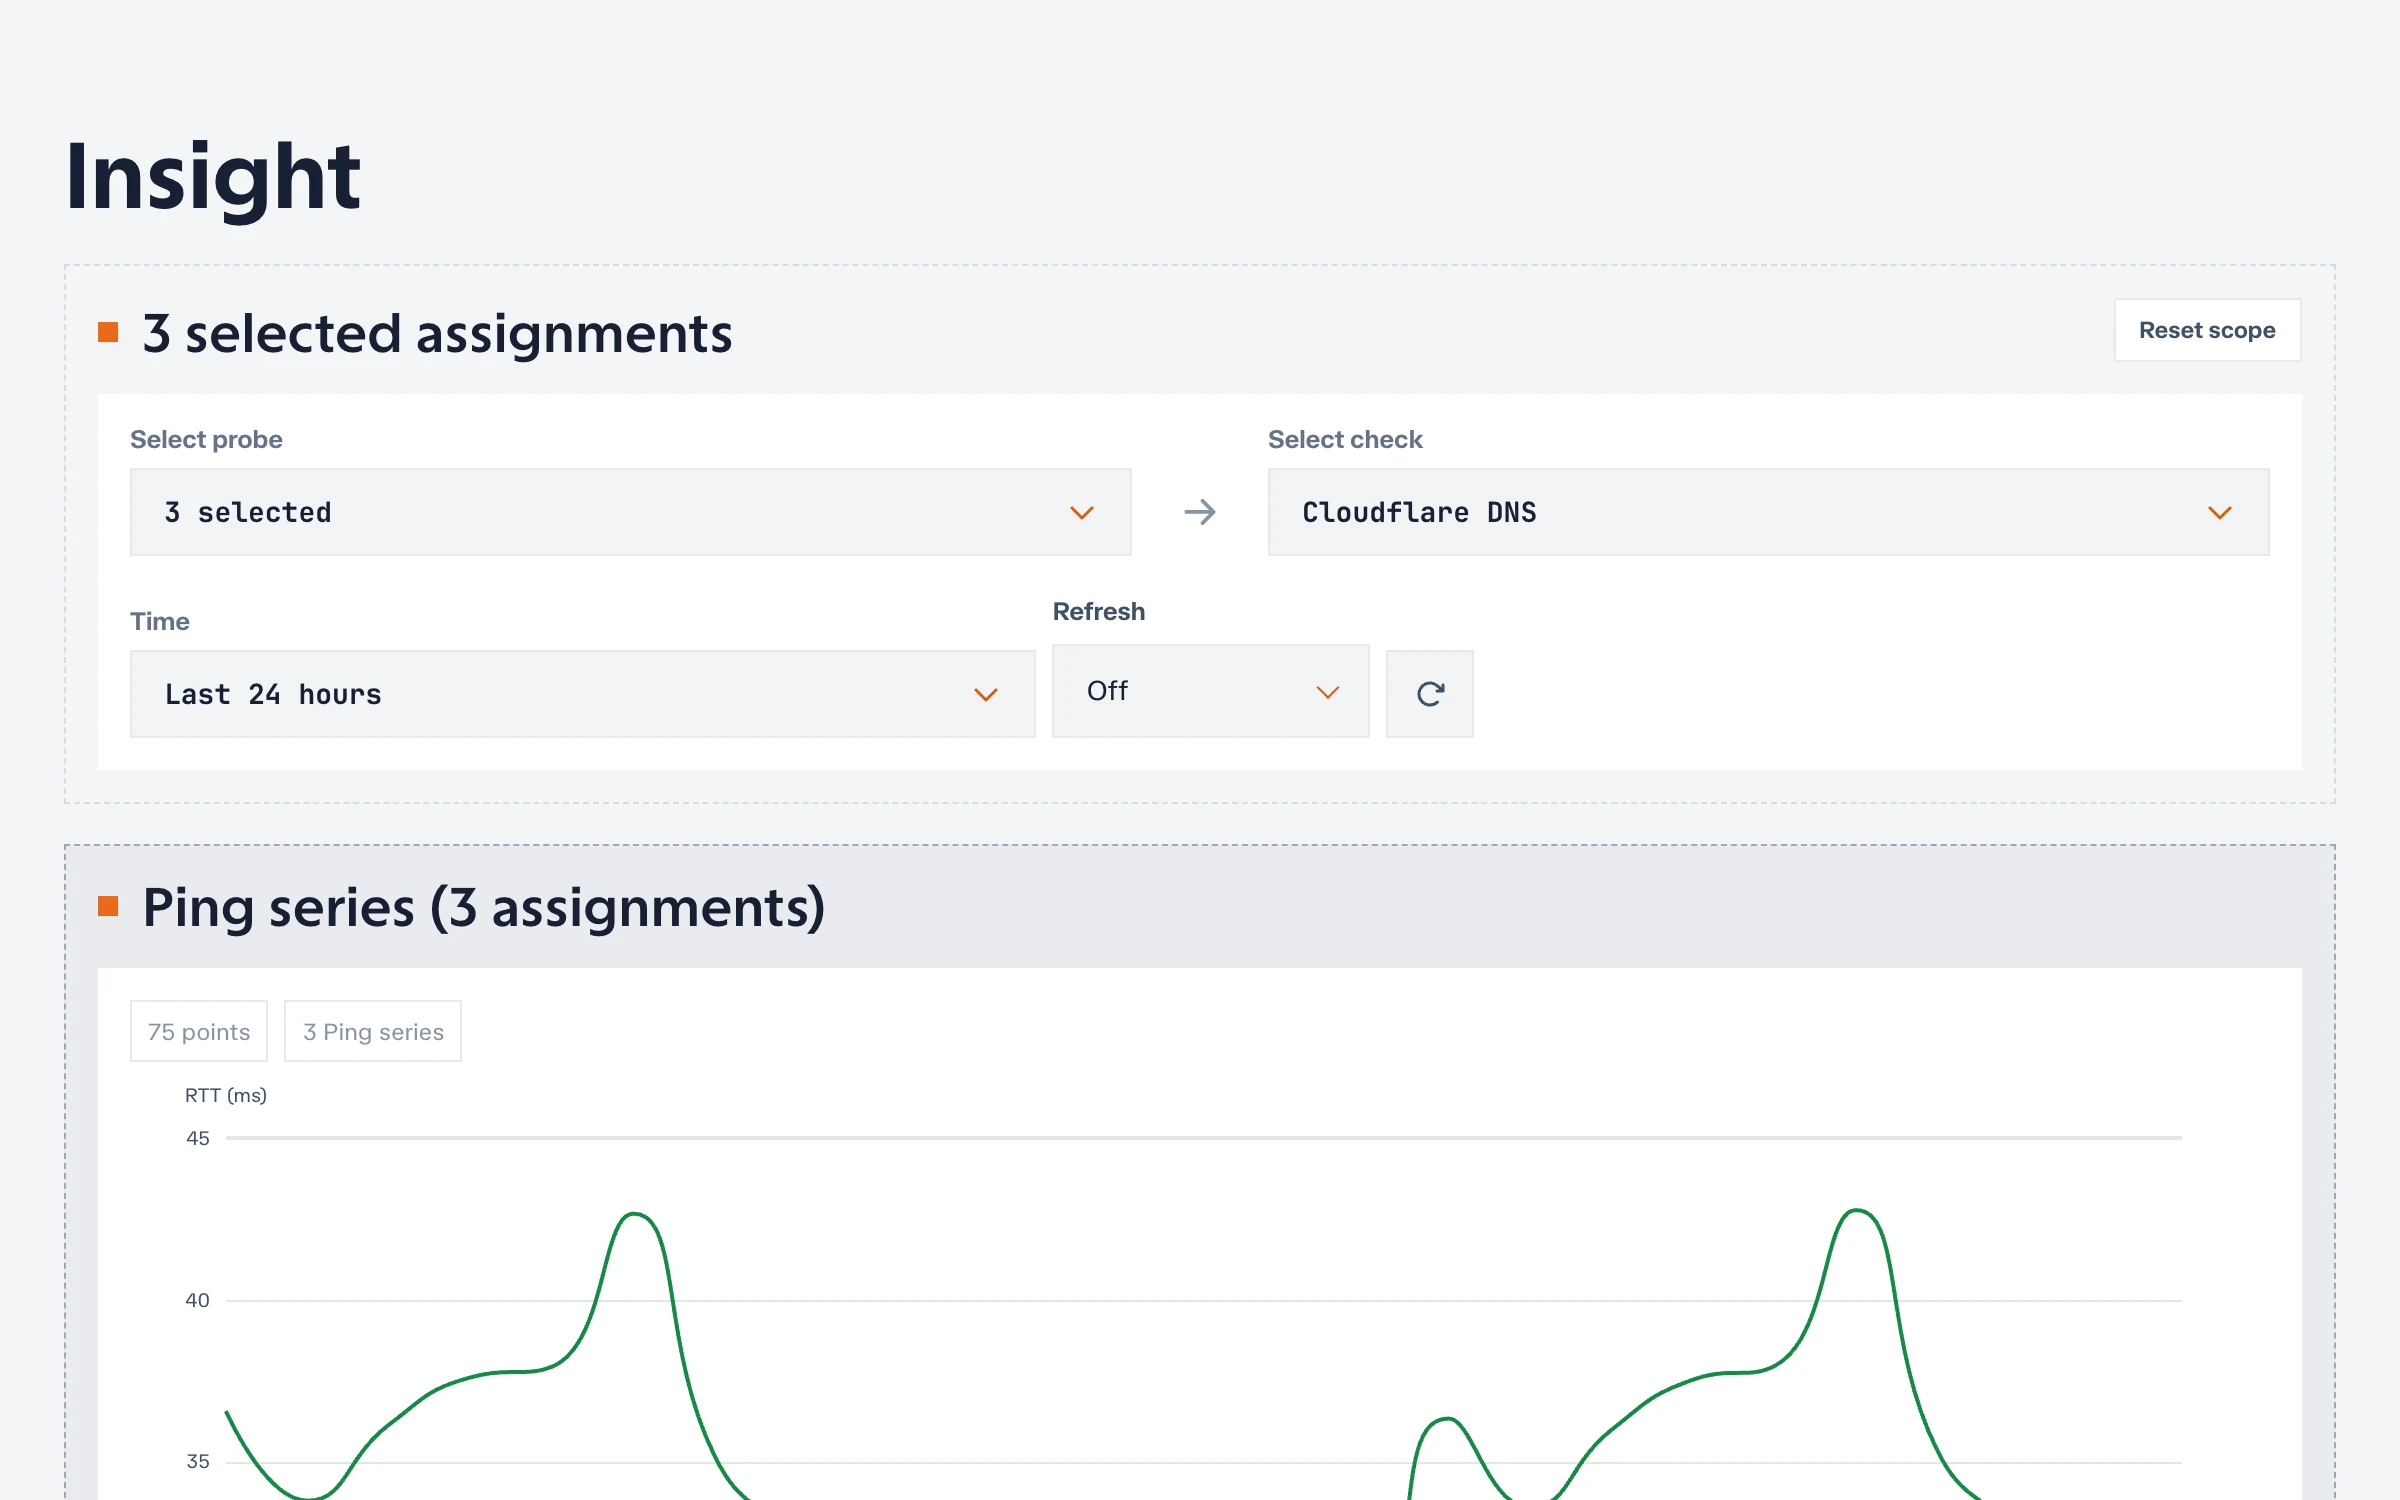
Use Reset scope to remove all probes, checks, legacy assignment parameters, and any selected Traceroute run. The time range and refresh preference remain available for the next investigation.
Control the time window
Open Time to choose a relative preset or an exact absolute interval.
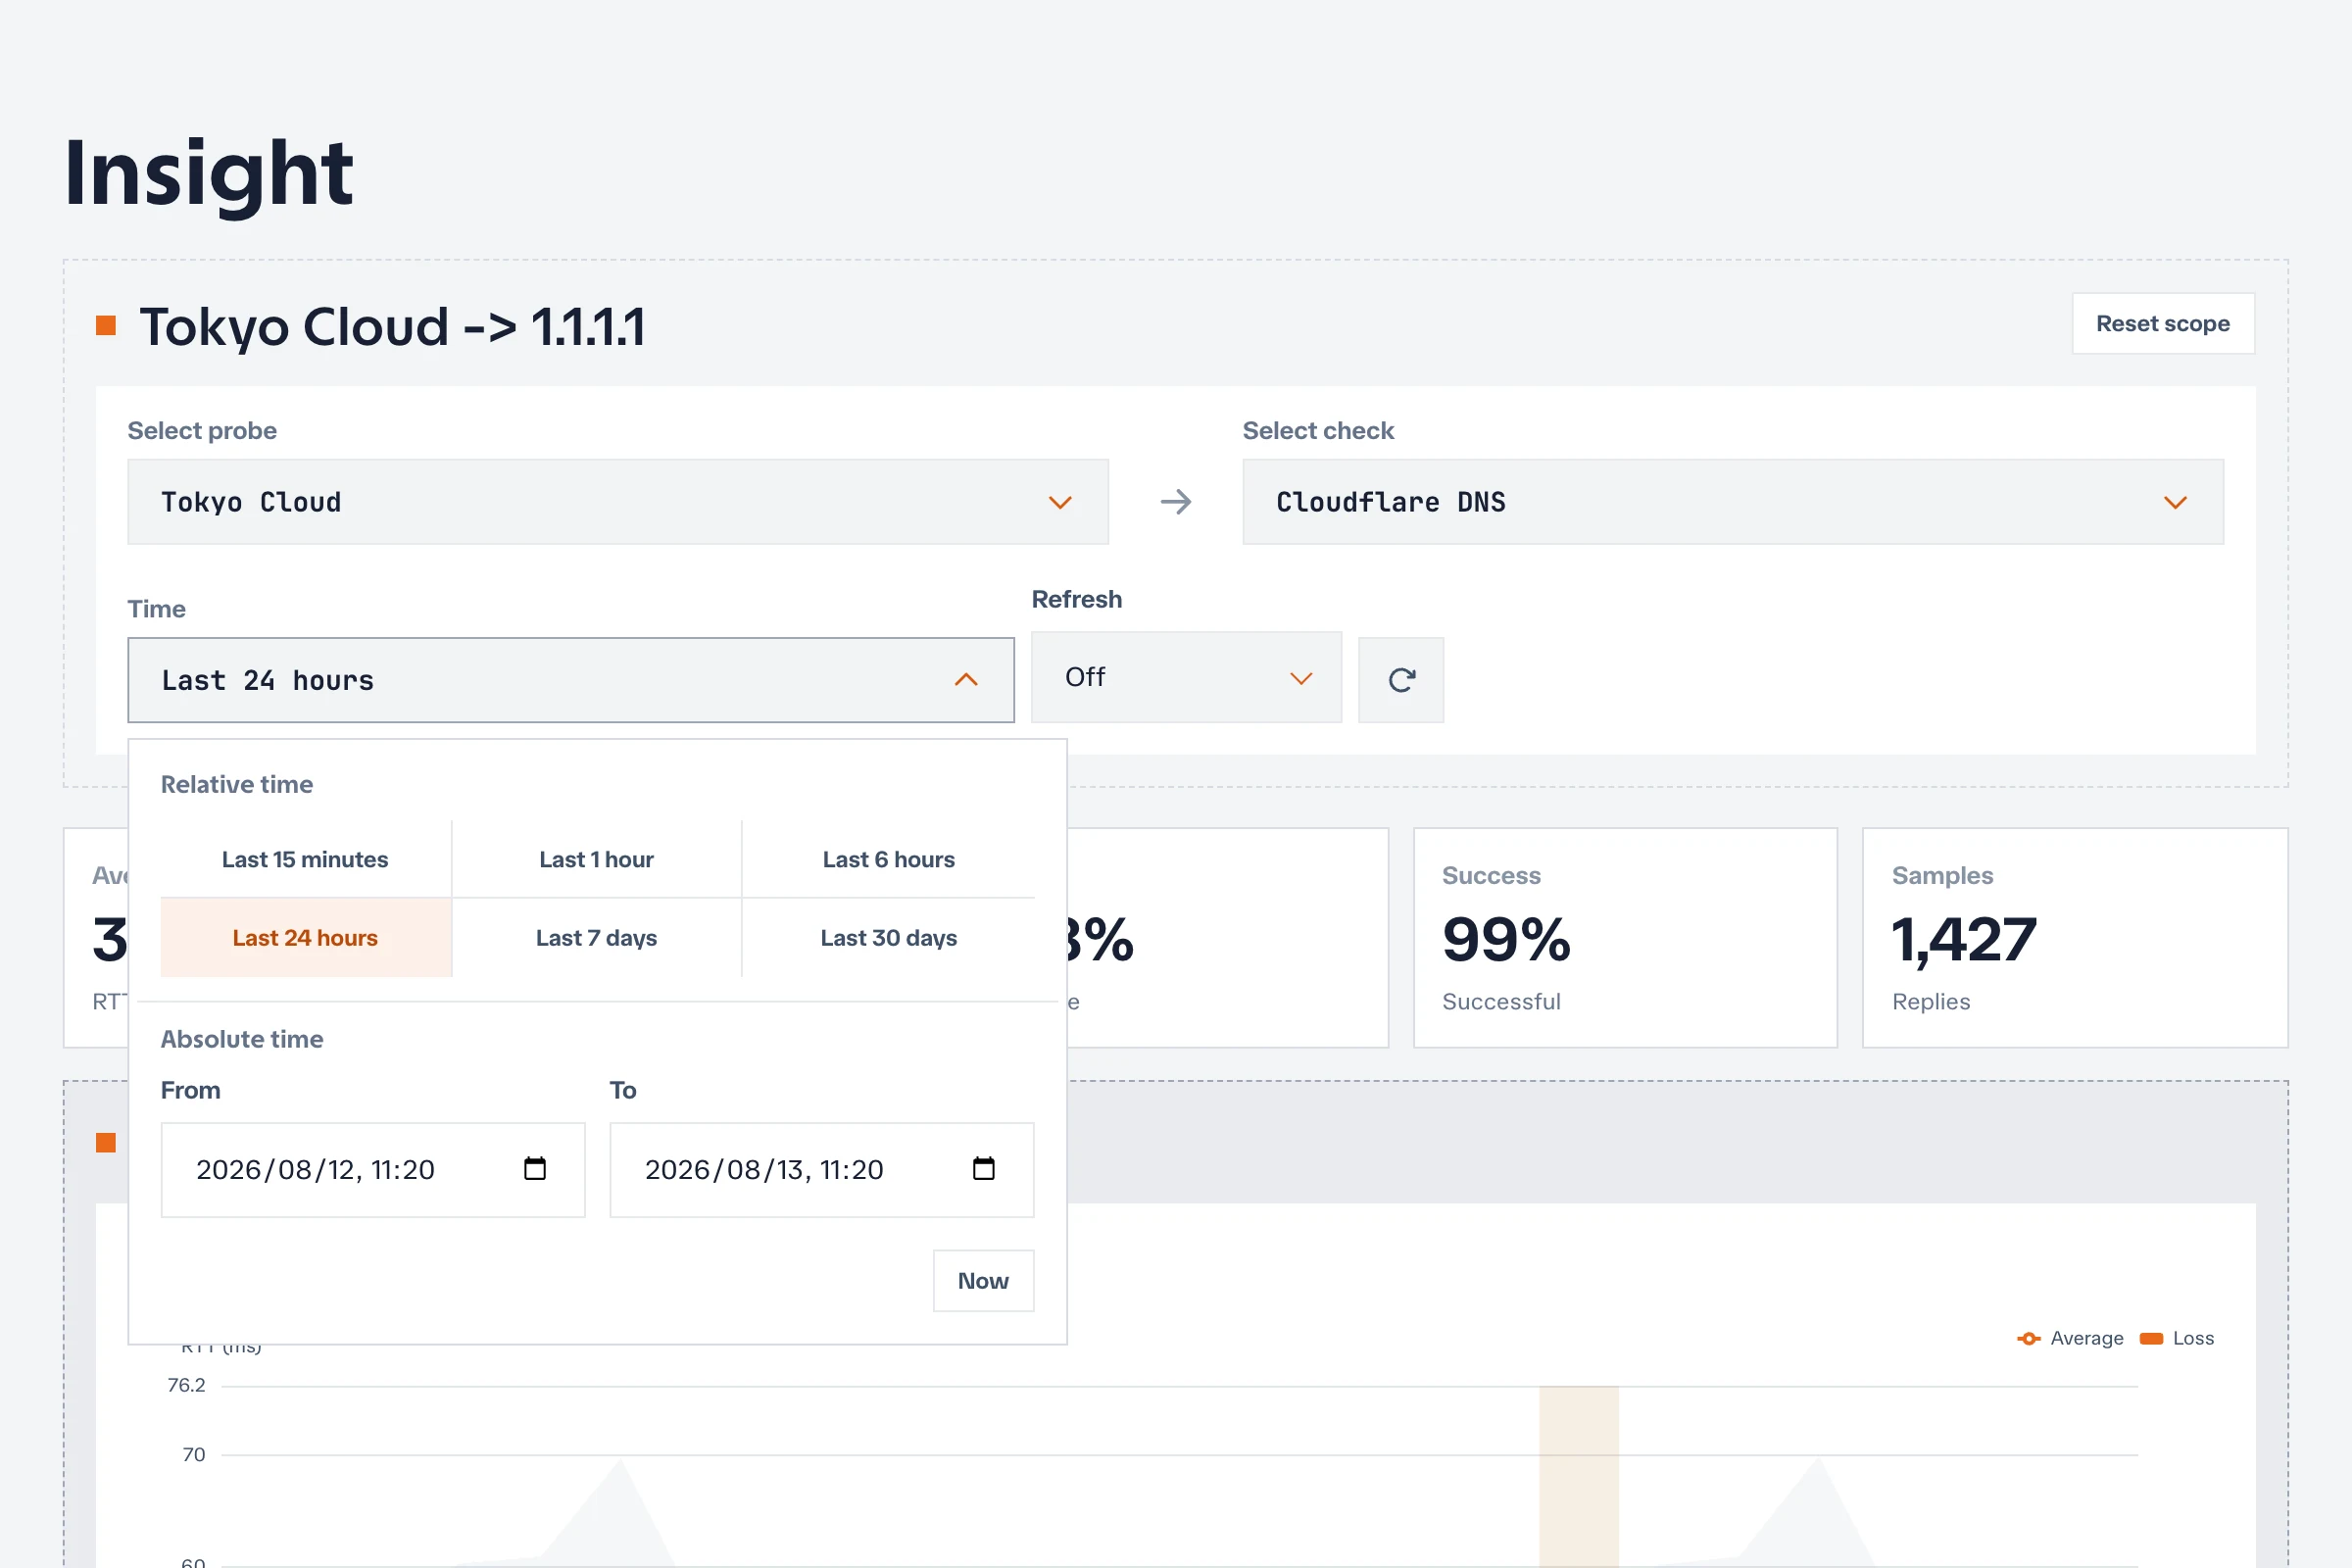
Relative ranges
Relative ranges end at the current time. Insight supports the last 15 minutes, 1 hour, 6 hours, 24 hours, 7 days, and 30 days. When you refresh a relative range, its end moves forward to the new current time.
Use a short range for an active incident. Use 24 hours or longer to establish whether a change is outside the normal baseline.
Absolute ranges
Absolute ranges keep fixed From and To timestamps. They are useful for incident reviews and shared investigations because refreshing does not move the window.
Using a chart’s zoom selection or range slider changes the global Insight window to the selected absolute interval. Select Now to preserve that interval’s duration while moving its end to the current time.
Refresh the data
Refresh controls how often Insight invalidates and reloads the current project data:
- Off leaves automatic refresh disabled.
10s,30s,1m, and5mrepeat the refresh at that interval.- The refresh button reloads immediately without changing the configured interval.
Relative time moves forward on every refresh. Absolute time remains fixed, so it can be refreshed without changing the incident boundaries.
Prefer a refresh interval that is no faster than the underlying check schedule. A 10-second page refresh does not create new measurements for a check that runs once per minute.
Read chart metadata
Every series panel reports its point count and data source or resolution. A point may be a raw measurement or an aggregate representing a larger bucket, depending on the selected duration and retained data.
- Use short ranges and raw points when exact event timing matters.
- Use aggregate points for trends and baseline comparisons.
- Do not treat a smooth aggregate line as proof that every individual run succeeded.
- A lower-than-expected point count can reflect the check interval, missing runs, retention, or aggregation.
Hover a series to read values at one timestamp. Use the legend to map each line to its probe, check, target, and location.
Share a reproducible view
Insight stores probe IDs, check IDs, time mode, time range, refresh interval, and a selected Traceroute run in the page URL. Copy the URL after setting the final scope.
Before sharing, record:
- The project and expected probe–check assignments.
- The displayed timezone.
- Whether the time window is relative or absolute.
- Any deployment, maintenance, routing, or DNS change inside the window.
If a shared URL references a probe, check, or assignment that no longer exists, Insight reports an invalid shared scope instead of silently substituting another resource.
Recognize empty states
| State | Meaning | Next action |
|---|---|---|
| No panels below the controls | No probe or check scope is selected | Select at least one probe |
| No active assignment | The selected resources exist but do not form an active pair | Check probe labels, check selectors, and enabled state |
| No series in the range | The assignment exists but no retained points match the time window | Expand the range and verify the probe is reporting |
| Invalid shared scope | The URL contains an unknown or removed resource | Reset the scope and rebuild the selection |
| Syncing | Existing data remains visible while a refresh is in progress | Wait before comparing the newest point |
Investigation workflow
For a repeatable investigation:
- Select the smallest scope that answers the question.
- Start with a relative range that includes the reported symptom.
- Compare multiple probes to decide whether the problem is local or target-wide.
- Narrow the chart to the event and switch to an absolute window.
- Interpret the relevant Ping, TCP, and HTTP results or Traceroute evidence.
- Share the final URL and correlate it with deployments or network changes.
- If the condition is repeatable, create an alert rule instead of relying on manual chart review.