
'%3e%3cpath%20d='m19.6%2066.5%2019.7-11%20.3-1-.3-.5h-1l-3.3-.2-11.2-.3L14%2053l-9.5-.5-2.4-.5L0%2049l.2-1.5%202-1.3%202.9.2%206.3.5%209.5.6%206.9.4L38%2049.1h1.6l.2-.7-.5-.4-.4-.4L29%2041l-10.6-7-5.6-4.1-3-2-1.5-2-.6-4.2%202.7-3%203.7.3.9.2%203.7%202.9%208%206.1L37%2036l1.5%201.2.6-.4.1-.3-.7-1.1L33%2025l-6-10.4-2.7-4.3-.7-2.6c-.3-1-.4-2-.4-3l3-4.2L28%200l4.2.6L33.8%202l2.6%206%204.1%209.3L47%2029.9l2%203.8%201%203.4.3%201h.7v-.5l.5-7.2%201-8.7%201-11.2.3-3.2%201.6-3.8%203-2L61%202.6l2%202.9-.3%201.8-1.1%207.7L59%2027.1l-1.5%208.2h.9l1-1.1%204.1-5.4%206.9-8.6%203-3.5L77%2013l2.3-1.8h4.3l3.1%204.7-1.4%204.9-4.4%205.6-3.7%204.7-5.3%207.1-3.2%205.7.3.4h.7l12-2.6%206.4-1.1%207.6-1.3%203.5%201.6.4%201.6-1.4%203.4-8.2%202-9.6%202-14.3%203.3-.2.1.2.3%206.4.6%202.8.2h6.8l12.6%201%203.3%202%201.9%202.7-.3%202-5.1%202.6-6.8-1.6-16-3.8-5.4-1.3h-.8v.4l4.6%204.5%208.3%207.5L89%2080.1l.5%202.4-1.3%202-1.4-.2-9.2-7-3.6-3-8-6.8h-.5v.7l1.8%202.7%209.8%2014.7.5%204.5-.7%201.4-2.6%201-2.7-.6-5.8-8-6-9-4.7-8.2-.5.4-2.9%2030.2-1.3%201.5-3%201.2-2.5-2-1.4-3%201.4-6.2%201.6-8%201.3-6.4%201.2-7.9.7-2.6v-.2H49L43%2072l-9%2012.3-7.2%207.6-1.7.7-3-1.5.3-2.8L24%2086l10-12.8%206-7.9%204-4.6-.1-.5h-.3L17.2%2077.4l-4.7.6-2-2%20.2-3%201-1%208-5.5Z'/%3e%3c/svg%3e)
Ping, TCP, and HTTP answer different questions about the same path. Investigate them in layers:
- Ping: Is the target reachable, and what does the round trip look like?
- TCP: Can the probe establish a connection to the service port?
- HTTP: Does the application return the expected response, and where is the request time spent?
First read Insight scope and time controls if you are not yet comfortable selecting one or more assignments.
Decide between detail and comparison
Select one probe and one check when you need summary metrics or the latest HTTP result. Select several probes with the same check when you need to determine whether a symptom is target-wide or isolated to one network.
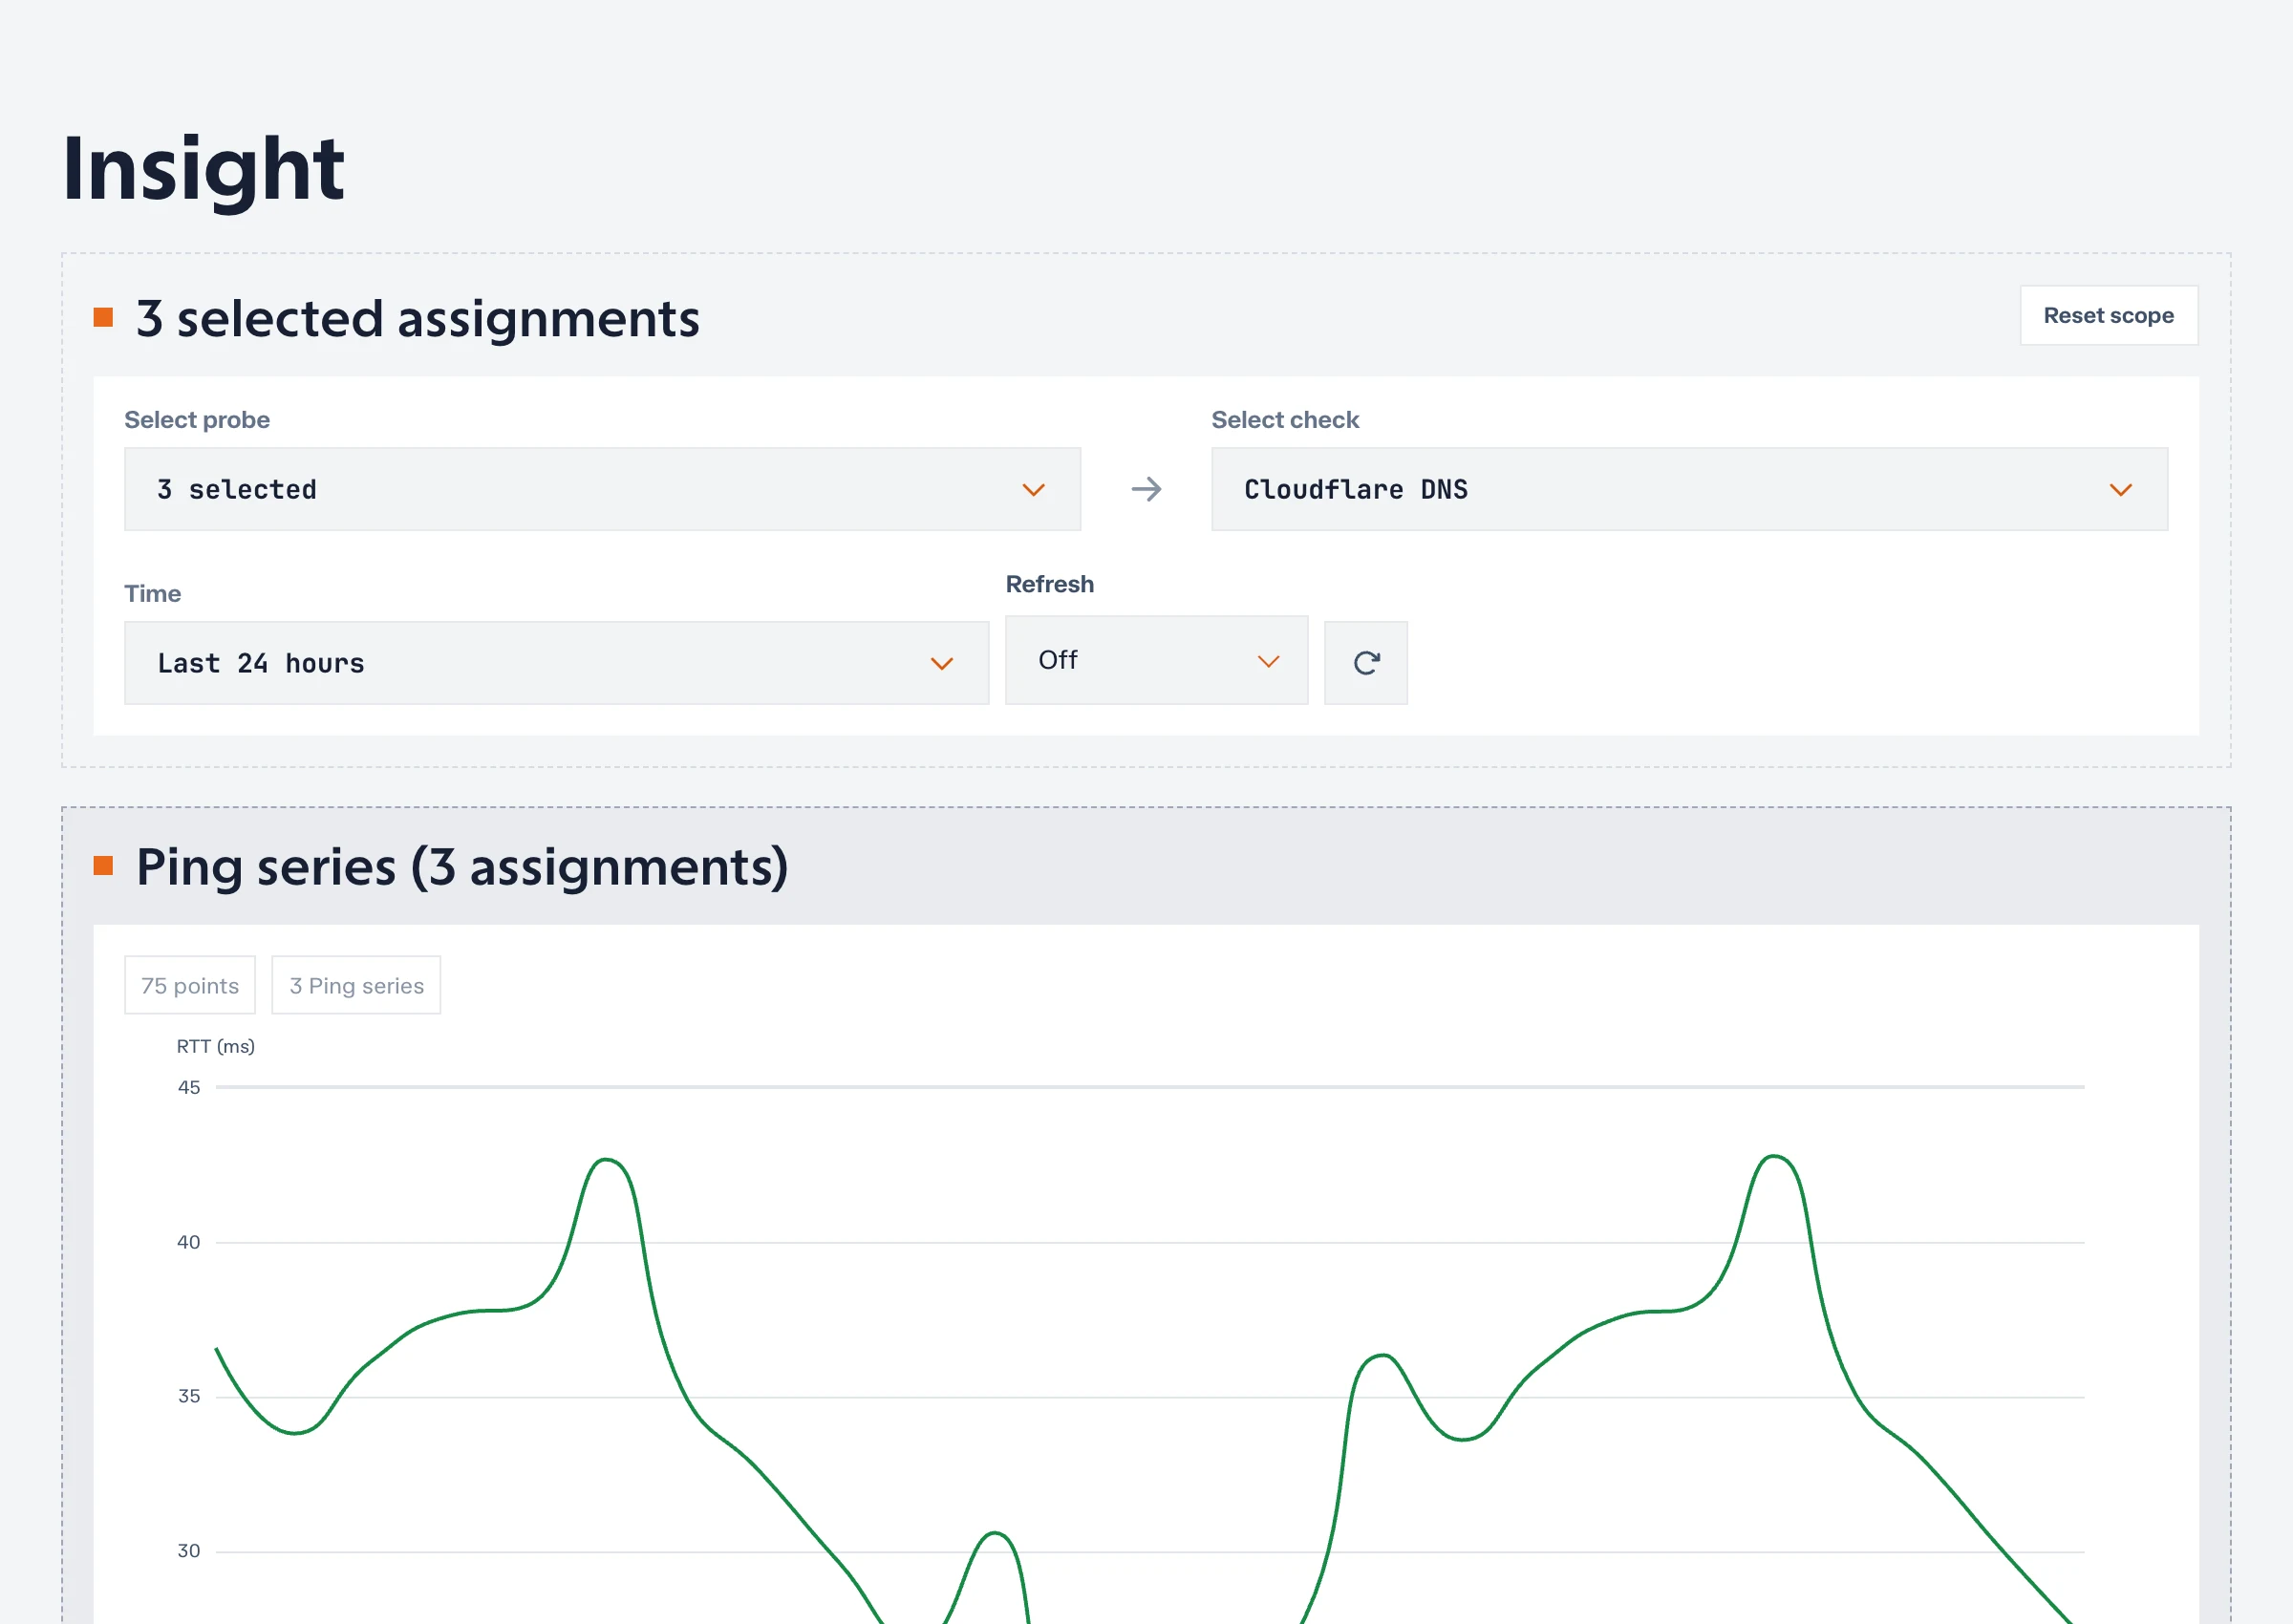
When several check types are selected, Insight creates a separate Ping, TCP, and HTTP panel. Traceroute uses its own topology and timeline views rather than a regular line-series panel.
Investigate reachability with Ping
Ping measures ICMP reachability, round-trip time, and packet loss.
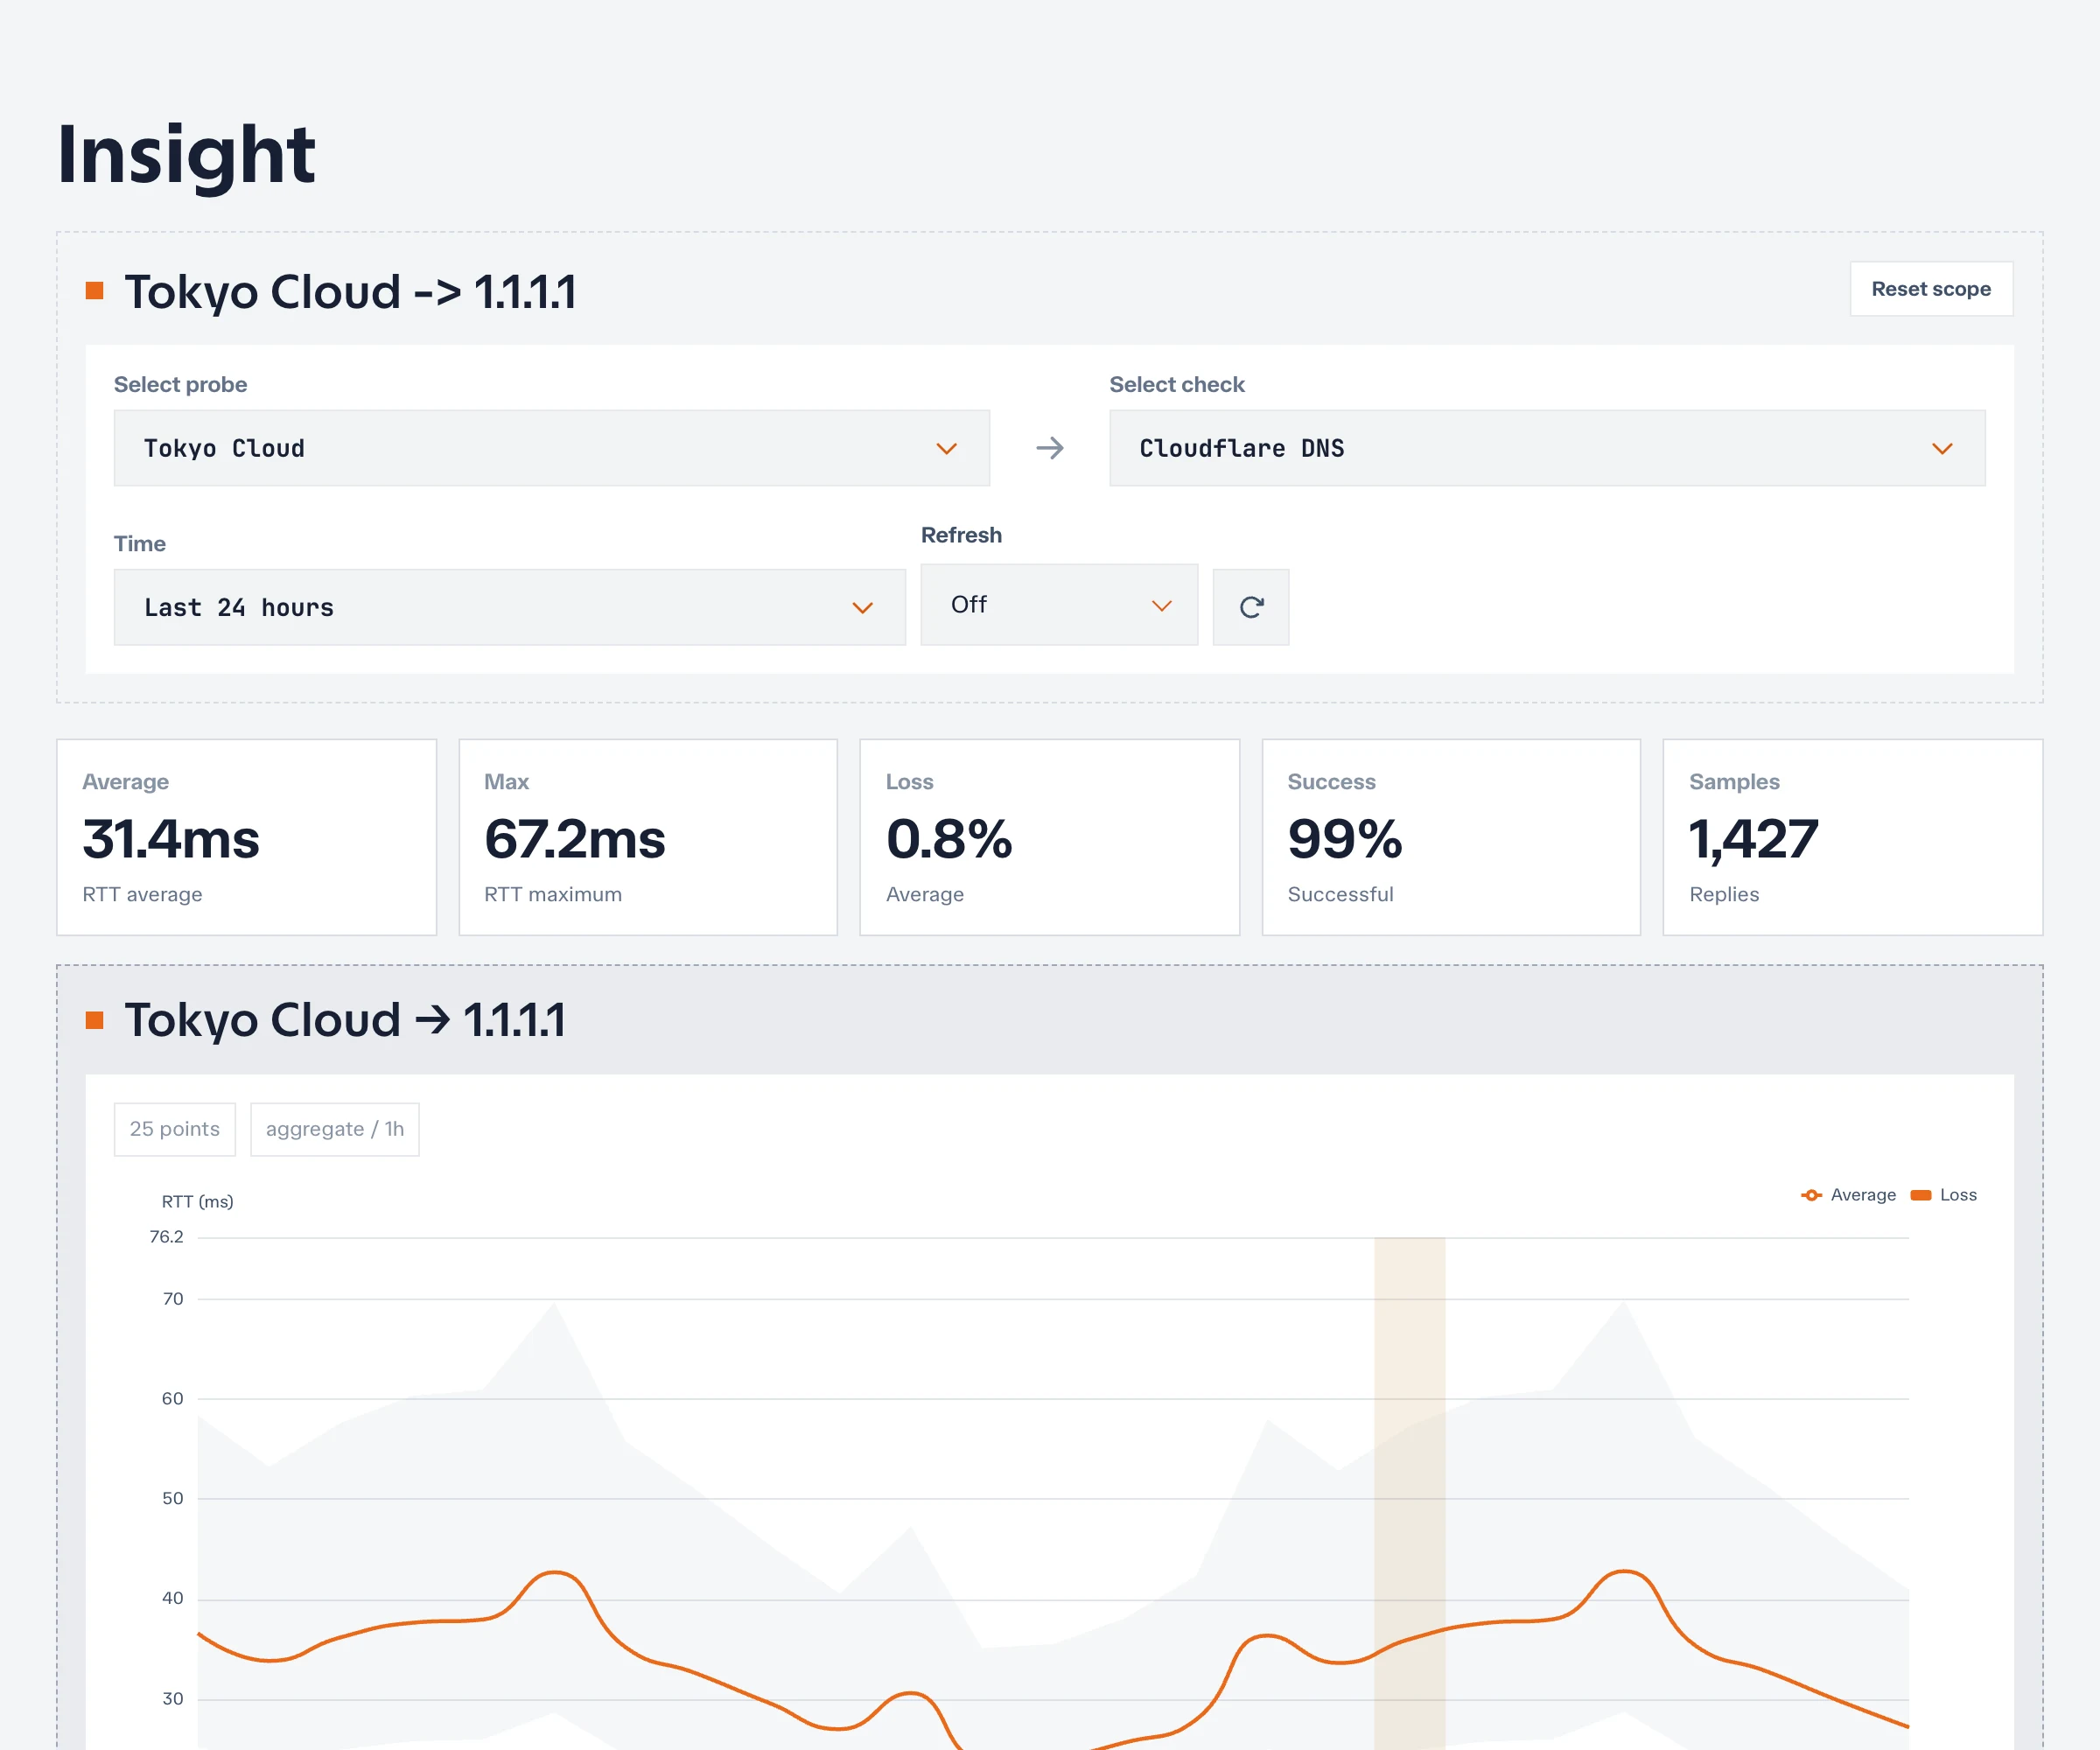
Read the summary
| Metric | What it tells you | What to check next |
|---|---|---|
| Average | Typical round-trip time in the selected range | Compare with the same probe’s baseline |
| Max | Worst retained round-trip measurement | Check whether it is isolated or sustained |
| Loss | Share of packets without replies | Compare other probes and downstream protocols |
| Success | Share of successful Ping results | Confirm whether loss is intermittent or continuous |
| Samples | Retained replies represented in the range | Check schedule, range, and missing data |
Look for shapes, not only headline values:
- A sustained level shift is more actionable than one isolated spike.
- Repeating peaks can align with backups, traffic bursts, or scheduled work.
- A gap is missing evidence; it is not automatically zero latency or a healthy period.
- Loss and high latency beginning together often indicate congestion or an unstable path.
Compare probes
| Observation | Likely scope | Verification |
|---|---|---|
| All probes change at the same time | Target, shared upstream, or a broad event | Compare TCP/HTTP and external changes |
| One probe changes | Local access network, regional path, or probe host | Compare another probe in the same region |
| Nearby probes change, distant probes do not | Regional provider or peering path | Inspect Traceroute from affected and unaffected probes |
| Ping fails but TCP/HTTP succeeds | ICMP filtering or deprioritization | Treat the service protocol as stronger availability evidence |
Do not use Ping alone to declare an application outage. Many networks filter or deprioritize ICMP while allowing the monitored service traffic.
Investigate service access with TCP
TCP measures whether the configured port accepts a connection and how long connection setup takes.
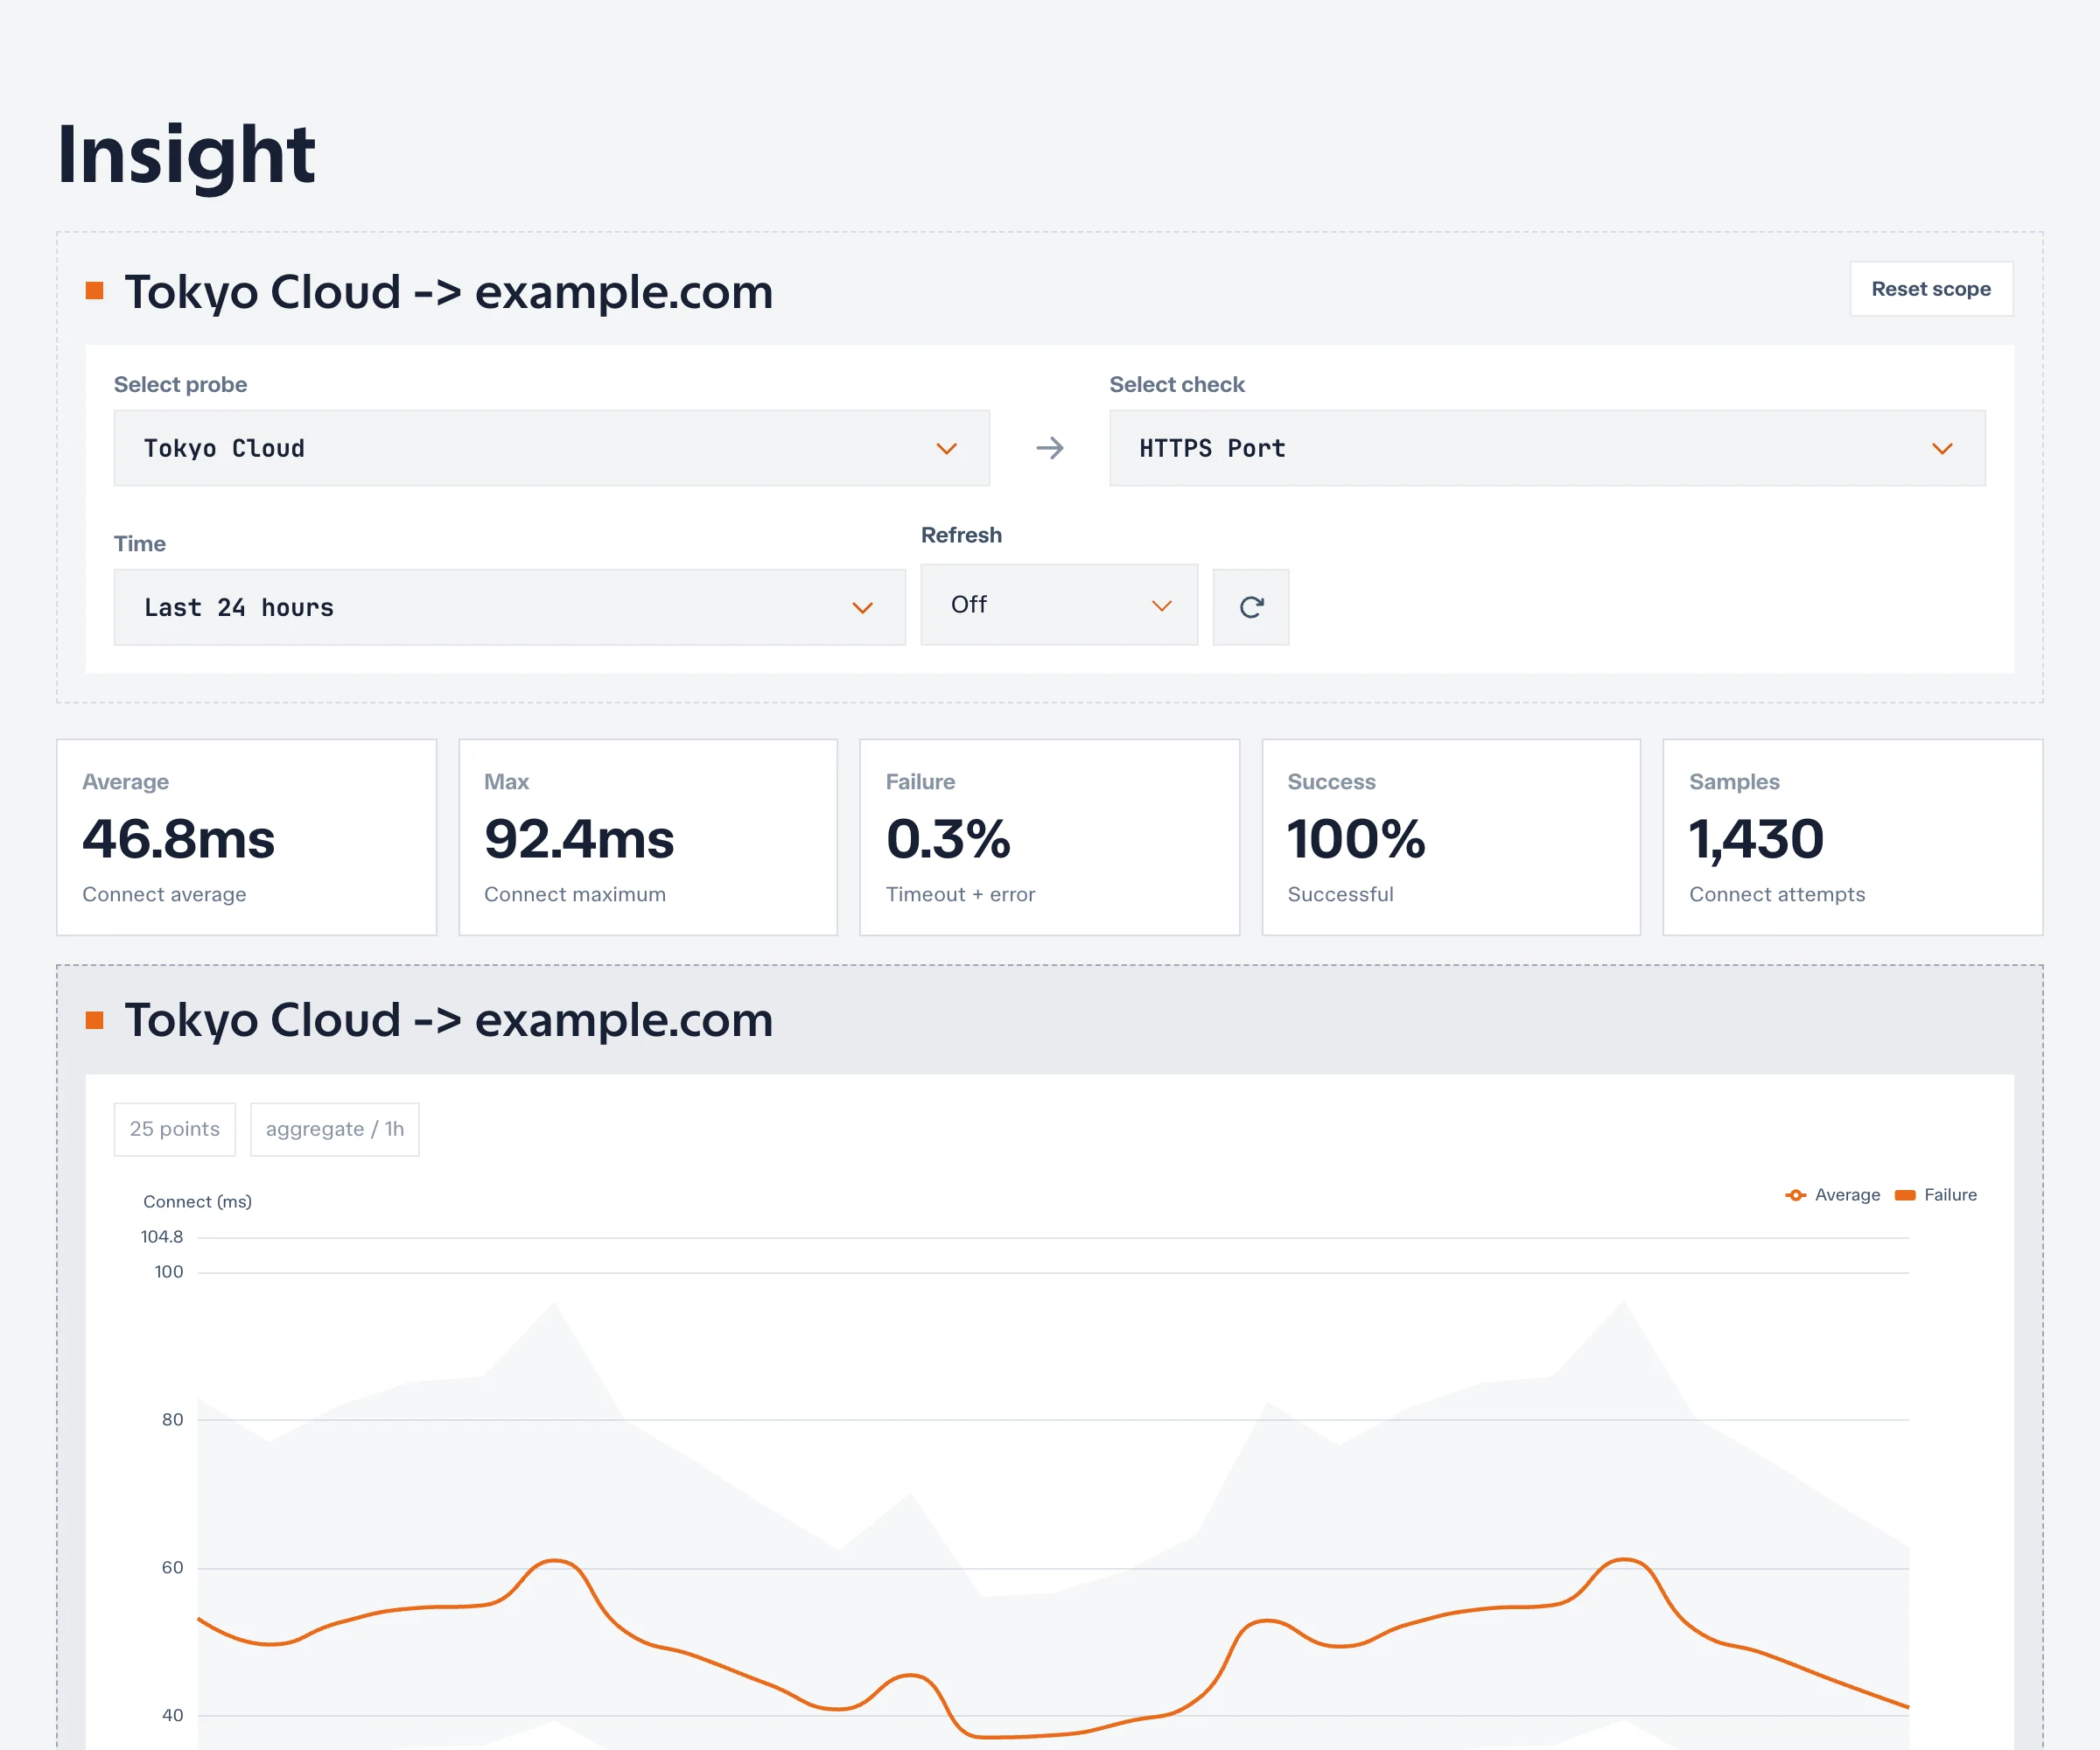
The summary reports average and maximum connection time, failure percentage, success percentage, and connection attempts. Interpret it with Ping:
| Ping | TCP | Interpretation |
|---|---|---|
| Successful | Successful | The network path and service port are reachable |
| Successful | Failing | Closed port, firewall, listener failure, overload, or connection refusal |
| Degraded | Degraded | Congestion, routing instability, or a busy endpoint may affect setup time |
| Failing | Successful | ICMP is likely blocked or treated differently from TCP |
| Failing | Failing | Broad reachability, routing, target, or probe-network problem |
If only one probe has slow TCP setup, investigate its network path. If every probe changes together while Ping remains stable, inspect the target listener, load balancer, firewall, and connection capacity.
Investigate application behavior with HTTP
HTTP combines transport evidence with response validation. Depending on the check configuration, a result can include status validation, body matching, redirects, response size, final URL, resolved address, request phases, and TLS negotiation.
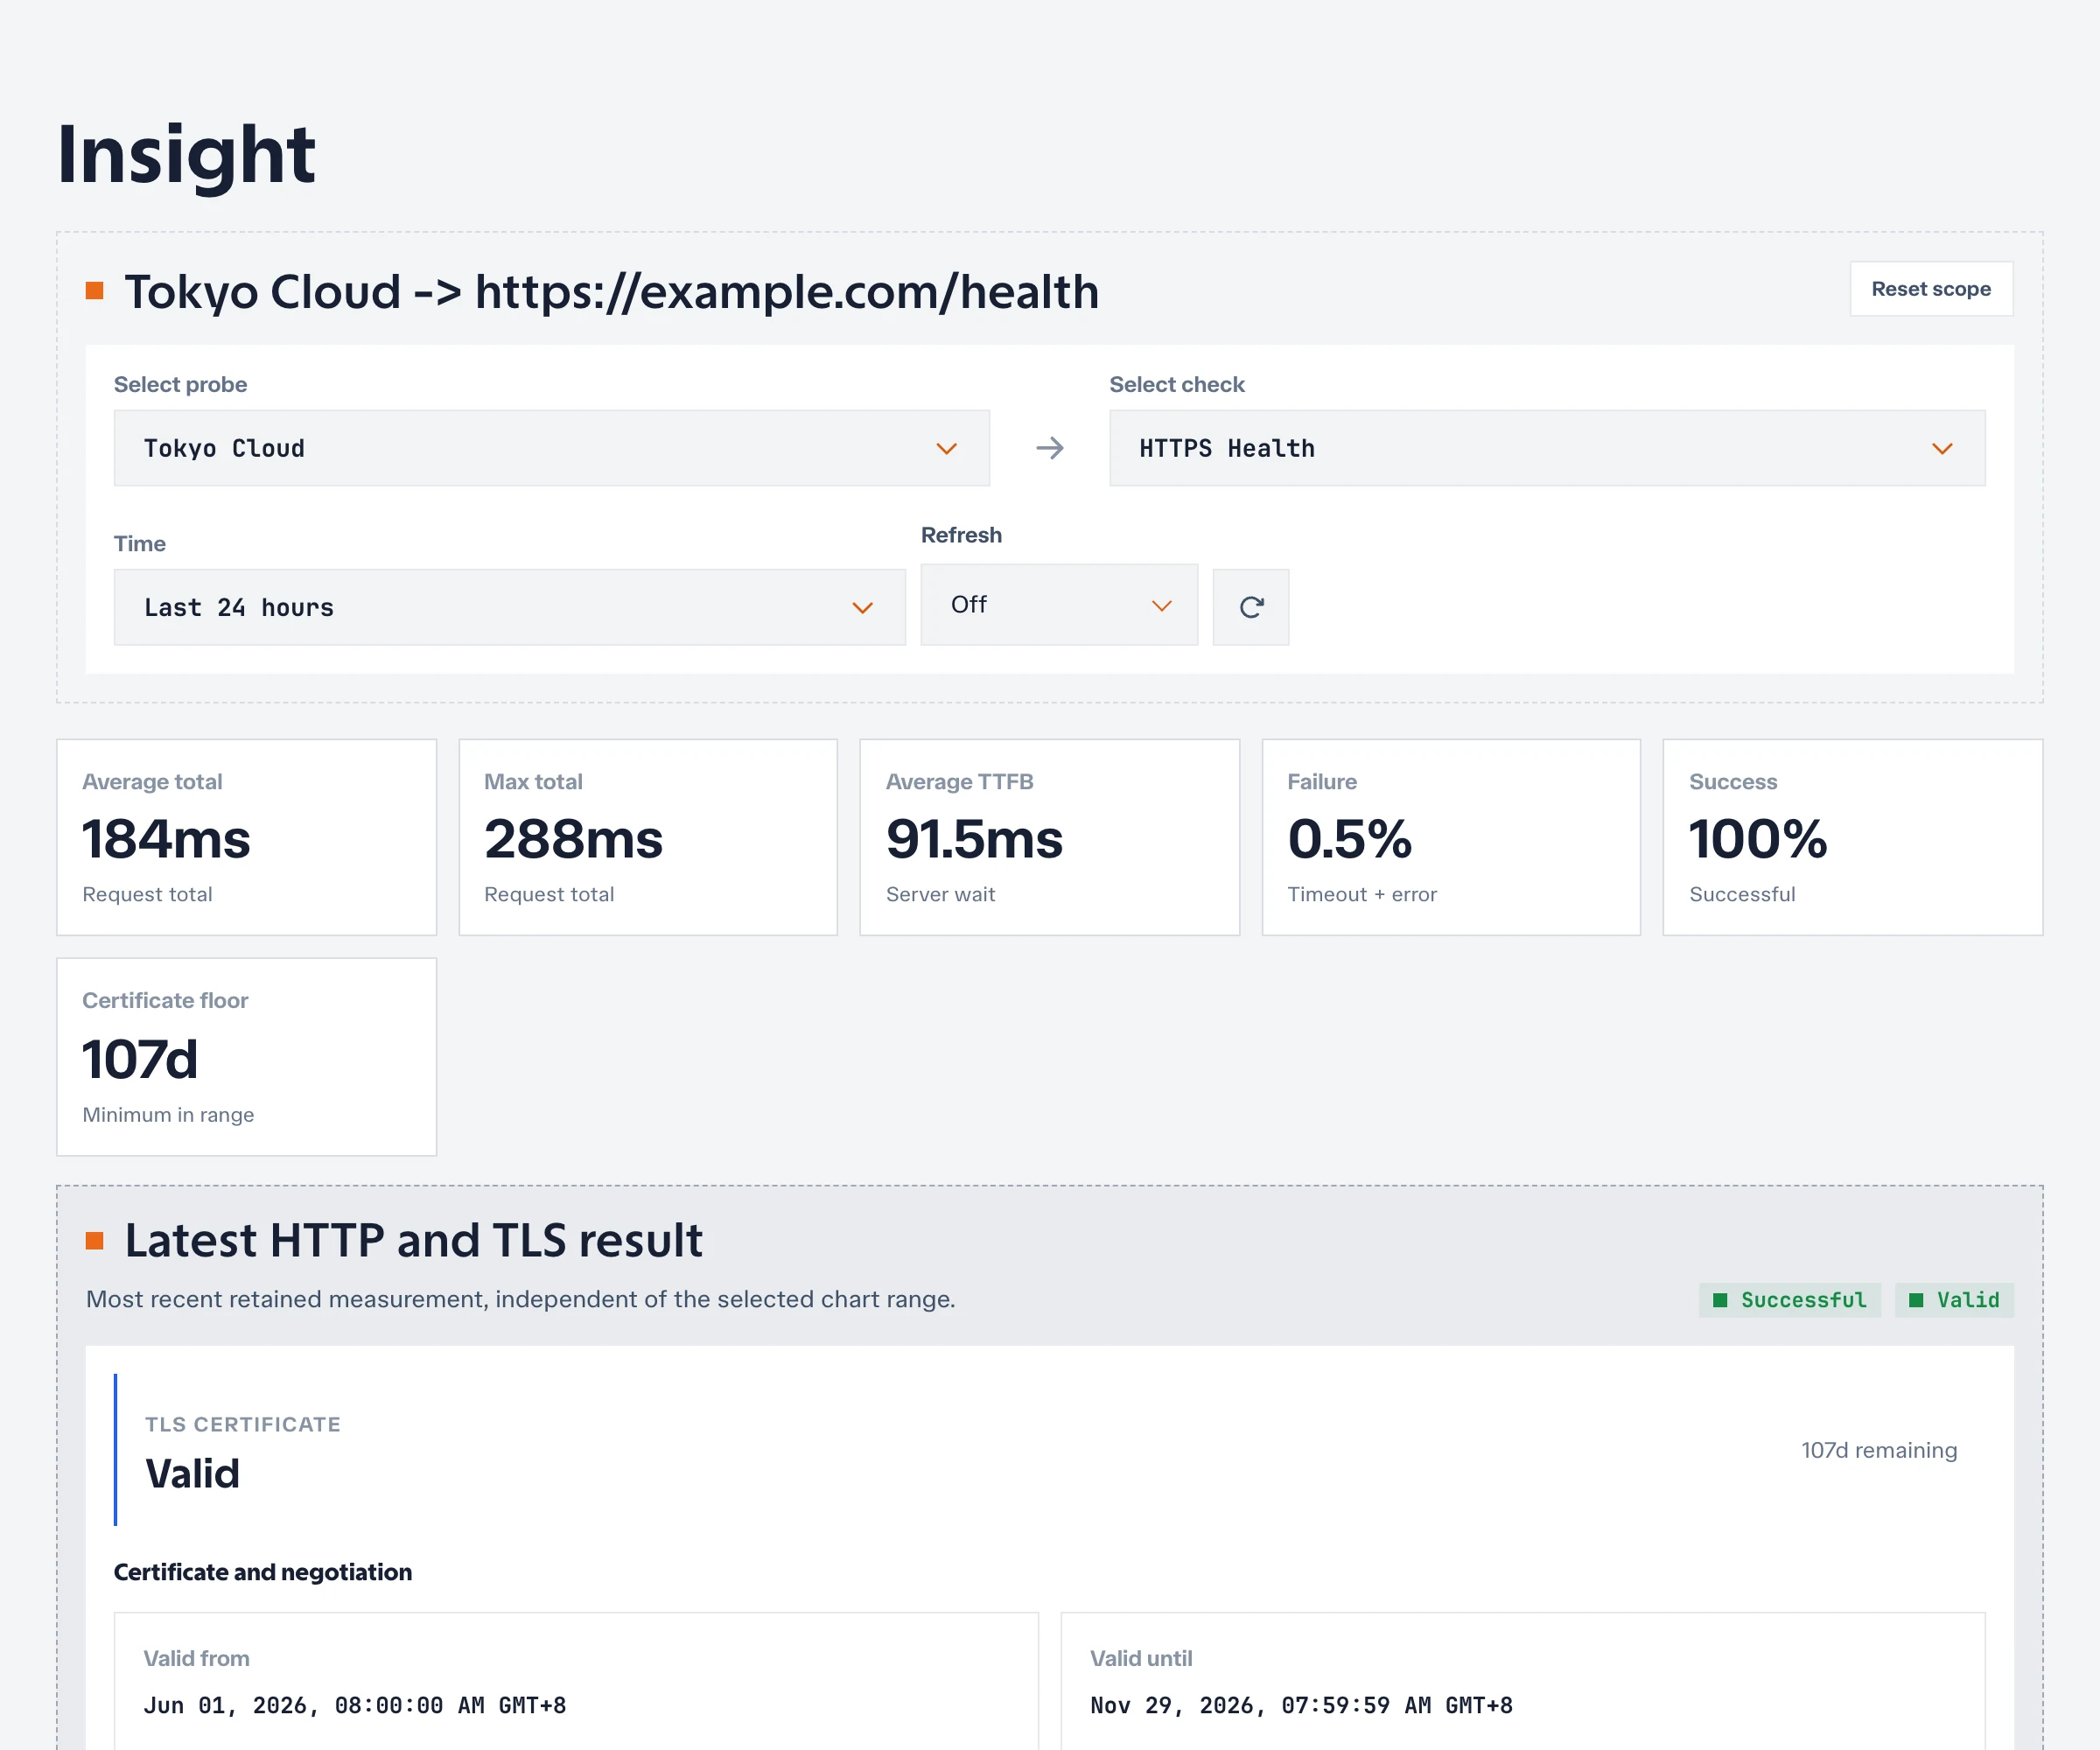
Read the summary and series
| Metric | Meaning |
|---|---|
| Average total | Typical end-to-end request duration in the selected range |
| Max total | Slowest retained request in the selected range |
| Average TTFB | Typical time until the first response byte |
| Failure | Requests that timed out, errored, or failed configured validation |
| Success | Requests that completed and satisfied the check |
| Certificate floor | Lowest remaining certificate lifetime observed in the range |
Use the phase series to narrow the likely owner:
- DNS increases: resolver latency, cache misses, or name-resolution failure.
- Connect increases: path latency, packet loss, firewall handling, load balancer pressure, or connection backlog.
- TLS increases: handshake latency, certificate-chain work, protocol negotiation, or an intercepting proxy.
- TTFB increases: upstream application, dependency, queue, or server processing time.
- Total increases while TTFB stays stable: response transfer, response size, or the later part of the request is more likely.
Inspect the latest retained result
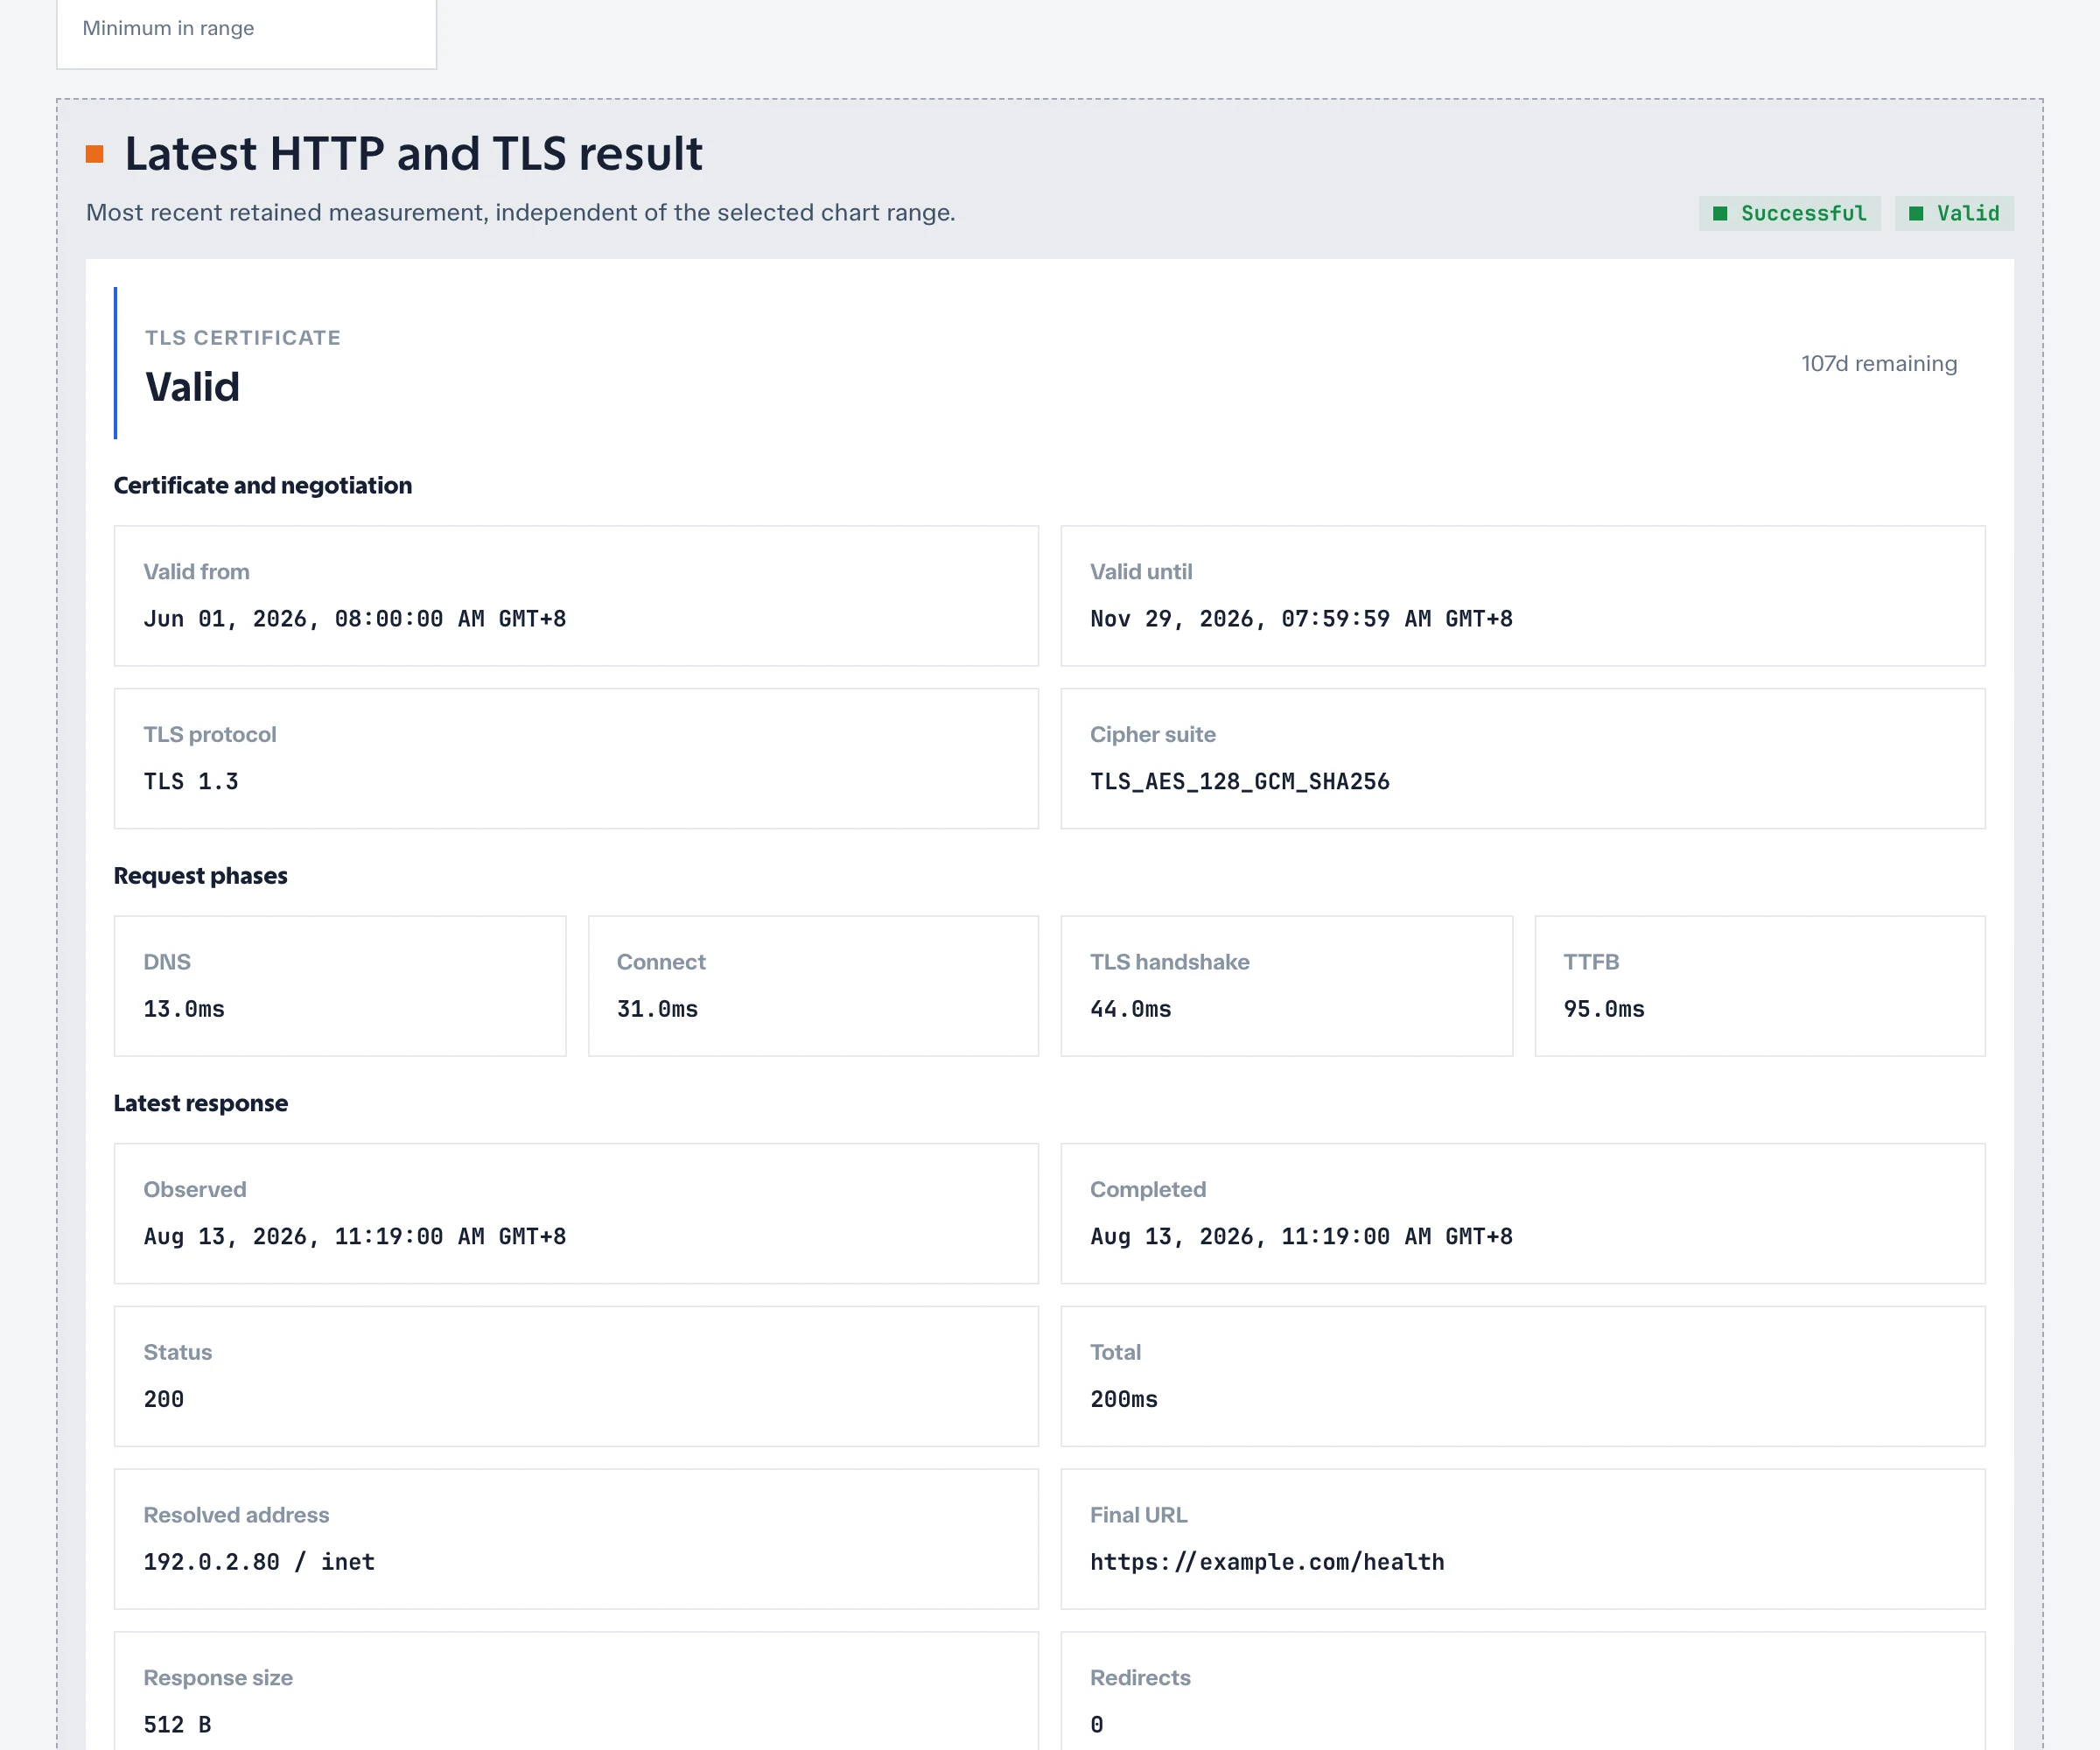
The latest result is independent of the selected chart range. It always represents the newest retained measurement for the exact assignment, even when the chart is showing an older absolute incident window.
Check:
- Observed and Completed before correlating it with the chart.
- Status and any error code or message.
- Resolved address to detect DNS or routing differences between probes.
- Final URL and Redirects to identify unexpected redirect behavior.
- Body assertion when the check validates response content.
- Response truncated before drawing conclusions from retained response metadata.
Compare TLS evidence
Selecting one HTTP/HTTPS check across several probes opens the TLS certificate inventory.
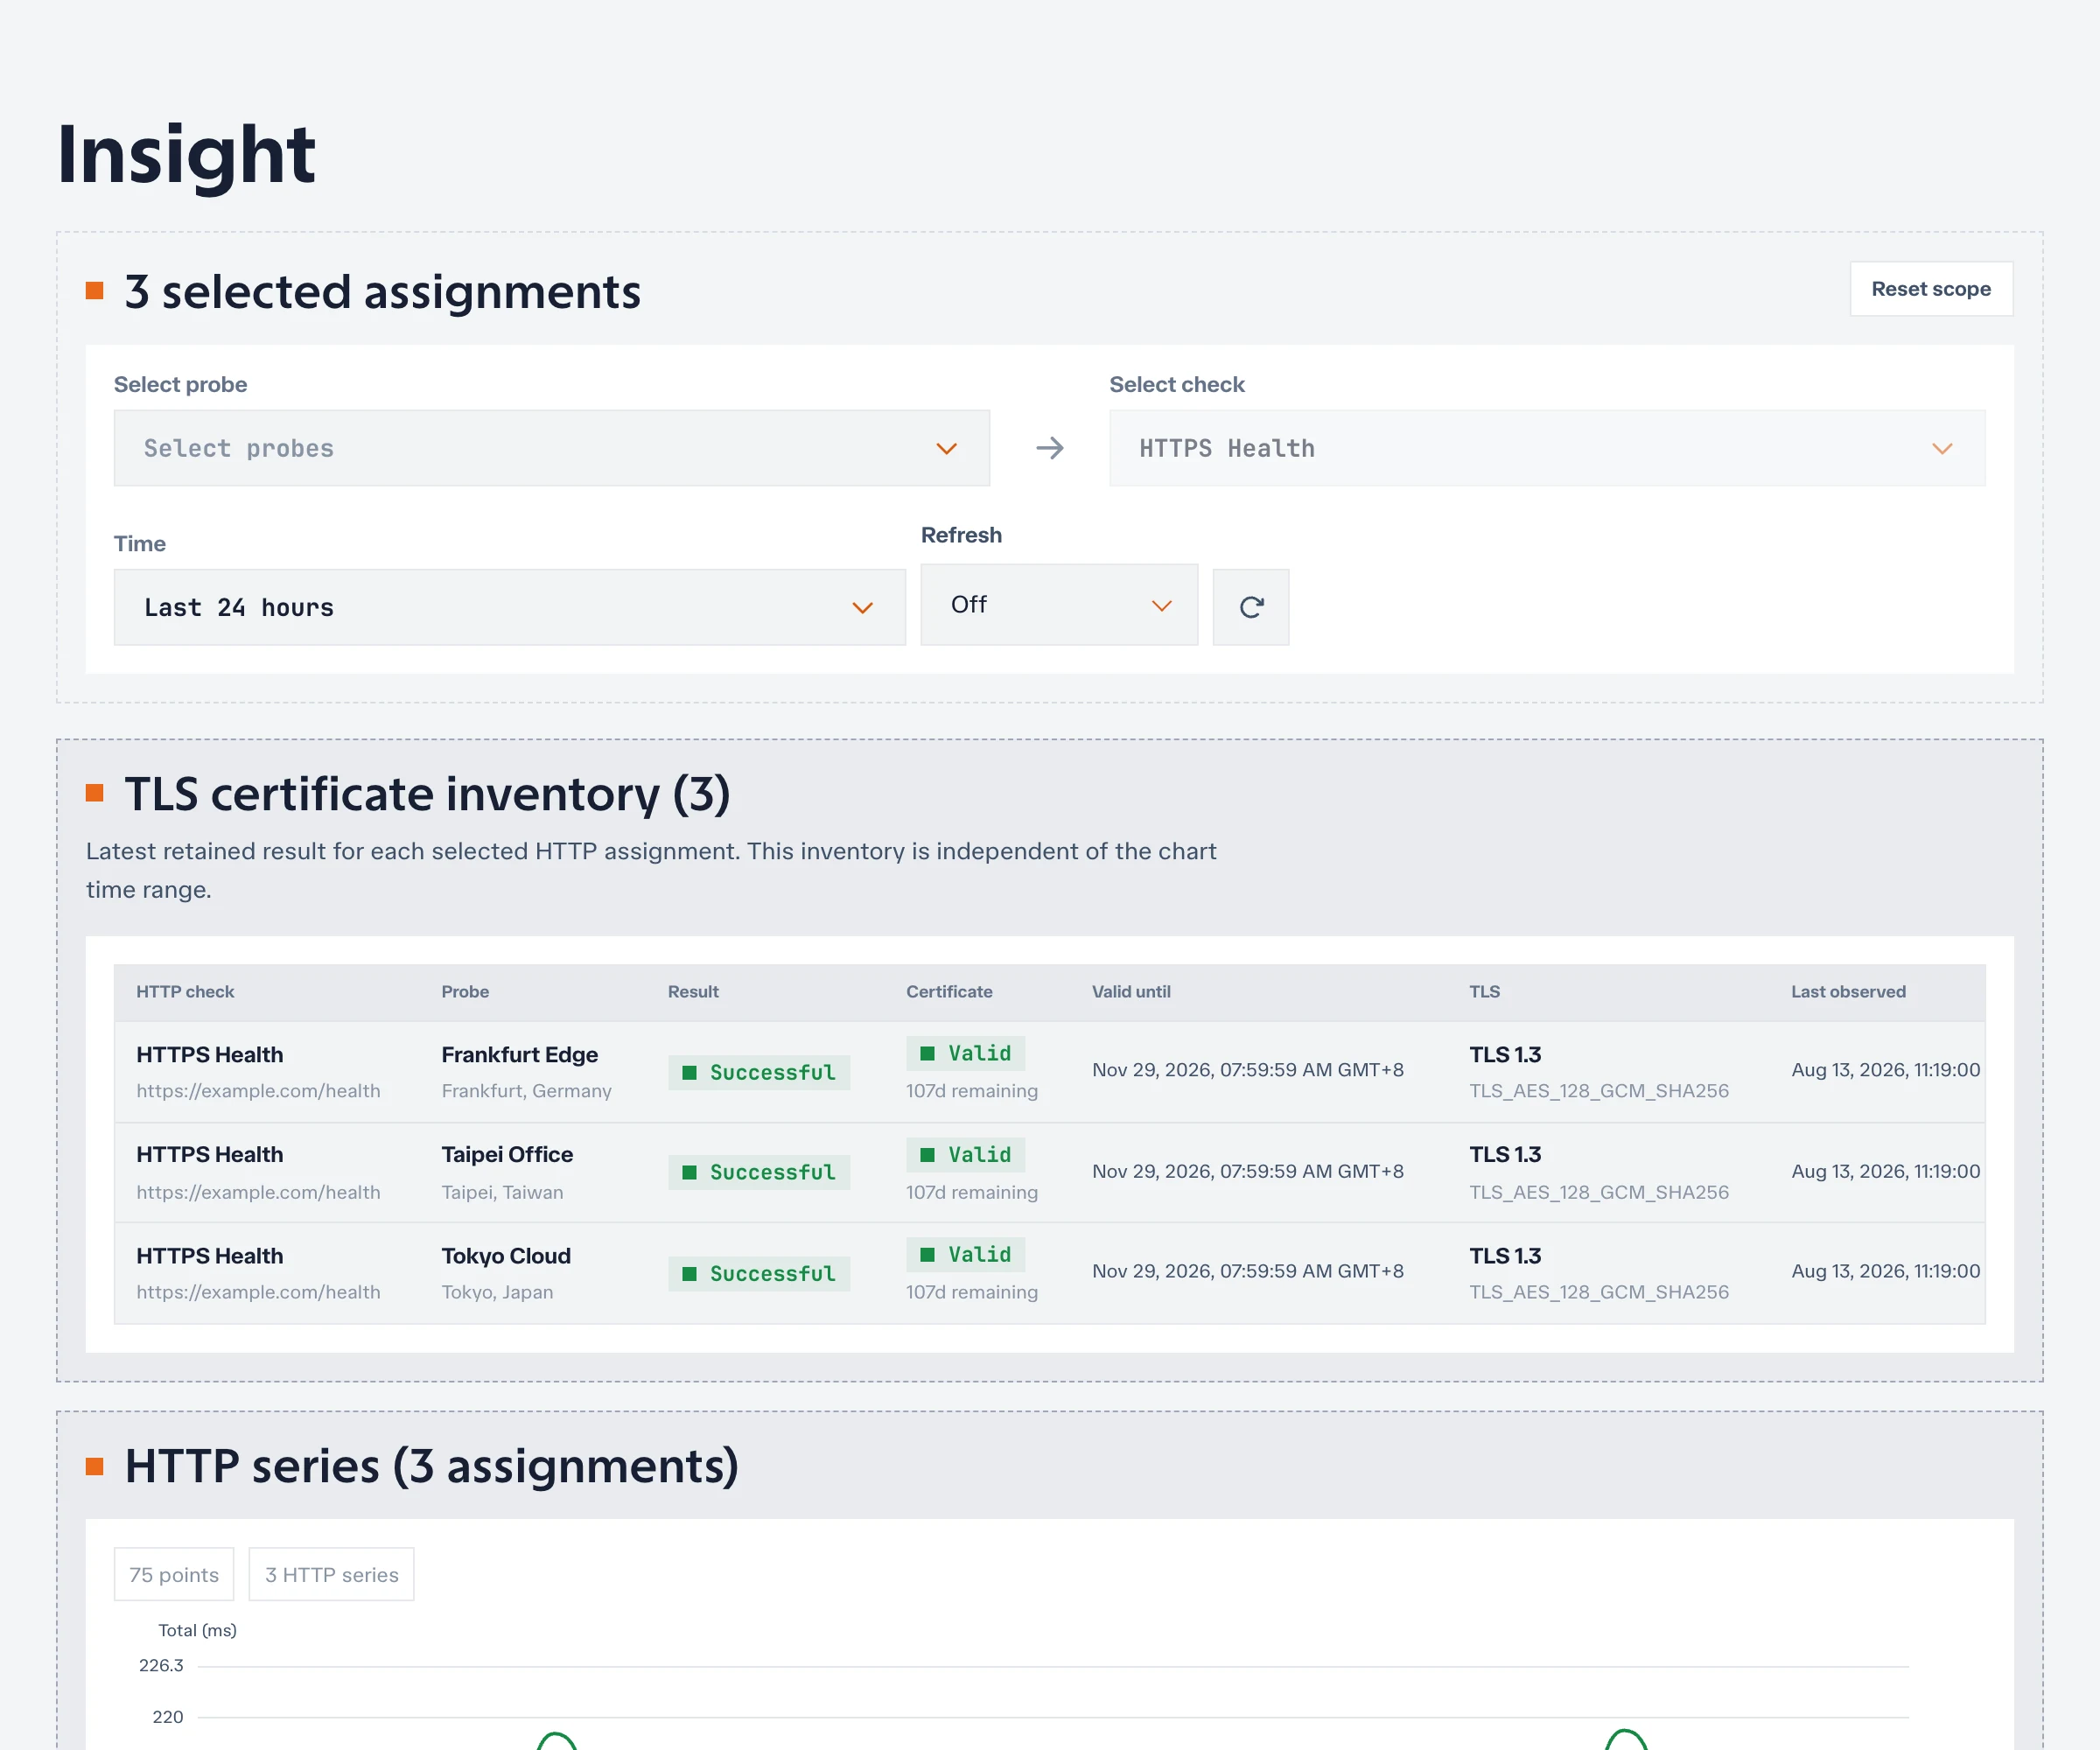
Like the latest HTTP result, the inventory is independent of the chart time range. Use Last observed to confirm freshness.
Differences between probes can reveal:
- A regional CDN edge serving a different certificate.
- A corporate proxy or TLS inspection device.
- Split-horizon DNS sending probes to different endpoints.
- A stale node that has not received a certificate rotation.
- Different TLS protocol or cipher support along one path.
A valid certificate does not prove that hostname validation, status validation, or the response body succeeded. Read the HTTP result and certificate state together.
Common mistakes
- Comparing different targets or check types as if they were the same series.
- Reading a long-range aggregate as an exact event timeline.
- Treating a missing point as a successful measurement.
- Treating Ping failure as proof that TCP or HTTP is unavailable.
- Using the latest HTTP/TLS panel without checking its timestamp.
- Comparing probes without considering their region, provider, labels, or resolved address.
- Enabling page refresh faster than the check produces measurements.
Turn evidence into action
After locating a repeatable condition:
- Narrow the chart to an absolute incident window.
- Save the Insight URL and note the timezone.
- Compare affected and unaffected probes.
- Use Traceroute when the evidence points to a path-specific problem.
- Create an alert rule for a stable threshold such as loss, failure percentage, or latency.