
'%3e%3cpath%20d='m19.6%2066.5%2019.7-11%20.3-1-.3-.5h-1l-3.3-.2-11.2-.3L14%2053l-9.5-.5-2.4-.5L0%2049l.2-1.5%202-1.3%202.9.2%206.3.5%209.5.6%206.9.4L38%2049.1h1.6l.2-.7-.5-.4-.4-.4L29%2041l-10.6-7-5.6-4.1-3-2-1.5-2-.6-4.2%202.7-3%203.7.3.9.2%203.7%202.9%208%206.1L37%2036l1.5%201.2.6-.4.1-.3-.7-1.1L33%2025l-6-10.4-2.7-4.3-.7-2.6c-.3-1-.4-2-.4-3l3-4.2L28%200l4.2.6L33.8%202l2.6%206%204.1%209.3L47%2029.9l2%203.8%201%203.4.3%201h.7v-.5l.5-7.2%201-8.7%201-11.2.3-3.2%201.6-3.8%203-2L61%202.6l2%202.9-.3%201.8-1.1%207.7L59%2027.1l-1.5%208.2h.9l1-1.1%204.1-5.4%206.9-8.6%203-3.5L77%2013l2.3-1.8h4.3l3.1%204.7-1.4%204.9-4.4%205.6-3.7%204.7-5.3%207.1-3.2%205.7.3.4h.7l12-2.6%206.4-1.1%207.6-1.3%203.5%201.6.4%201.6-1.4%203.4-8.2%202-9.6%202-14.3%203.3-.2.1.2.3%206.4.6%202.8.2h6.8l12.6%201%203.3%202%201.9%202.7-.3%202-5.1%202.6-6.8-1.6-16-3.8-5.4-1.3h-.8v.4l4.6%204.5%208.3%207.5L89%2080.1l.5%202.4-1.3%202-1.4-.2-9.2-7-3.6-3-8-6.8h-.5v.7l1.8%202.7%209.8%2014.7.5%204.5-.7%201.4-2.6%201-2.7-.6-5.8-8-6-9-4.7-8.2-.5.4-2.9%2030.2-1.3%201.5-3%201.2-2.5-2-1.4-3%201.4-6.2%201.6-8%201.3-6.4%201.2-7.9.7-2.6v-.2H49L43%2072l-9%2012.3-7.2%207.6-1.7.7-3-1.5.3-2.8L24%2086l10-12.8%206-7.9%204-4.6-.1-.5h-.3L17.2%2077.4l-4.7.6-2-2%20.2-3%201-1%208-5.5Z'/%3e%3c/svg%3e)
Traceroute shows the network hops observed between a probe and a target. It is strongest as supporting evidence: use it to explain a path-specific change already visible in Ping, TCP, or HTTP, not as a standalone availability test.
Read Insight scope and time controls before using this guide.
Choose the investigation scope
Use one exact probe–check assignment when you need a hop table or individual run. Use a broader scope when you need an aggregated route graph:
| Scope | What Insight displays |
|---|---|
| One probe and one Traceroute check | Aggregated topology plus the selected run’s hop diagnostics and timeline |
| One probe and several checks | Topology observed from that probe; non-Traceroute checks receive their own series panels |
| Several probes and one Traceroute check | Aggregated topology for the target across the selected probes |
| Several probes and several checks | No combined topology unless one dimension is narrowed to one probe or one check |
Keep the time range short enough that route changes remain distinguishable. A large range can merge several valid paths into one complex topology.
Read the aggregated route graph
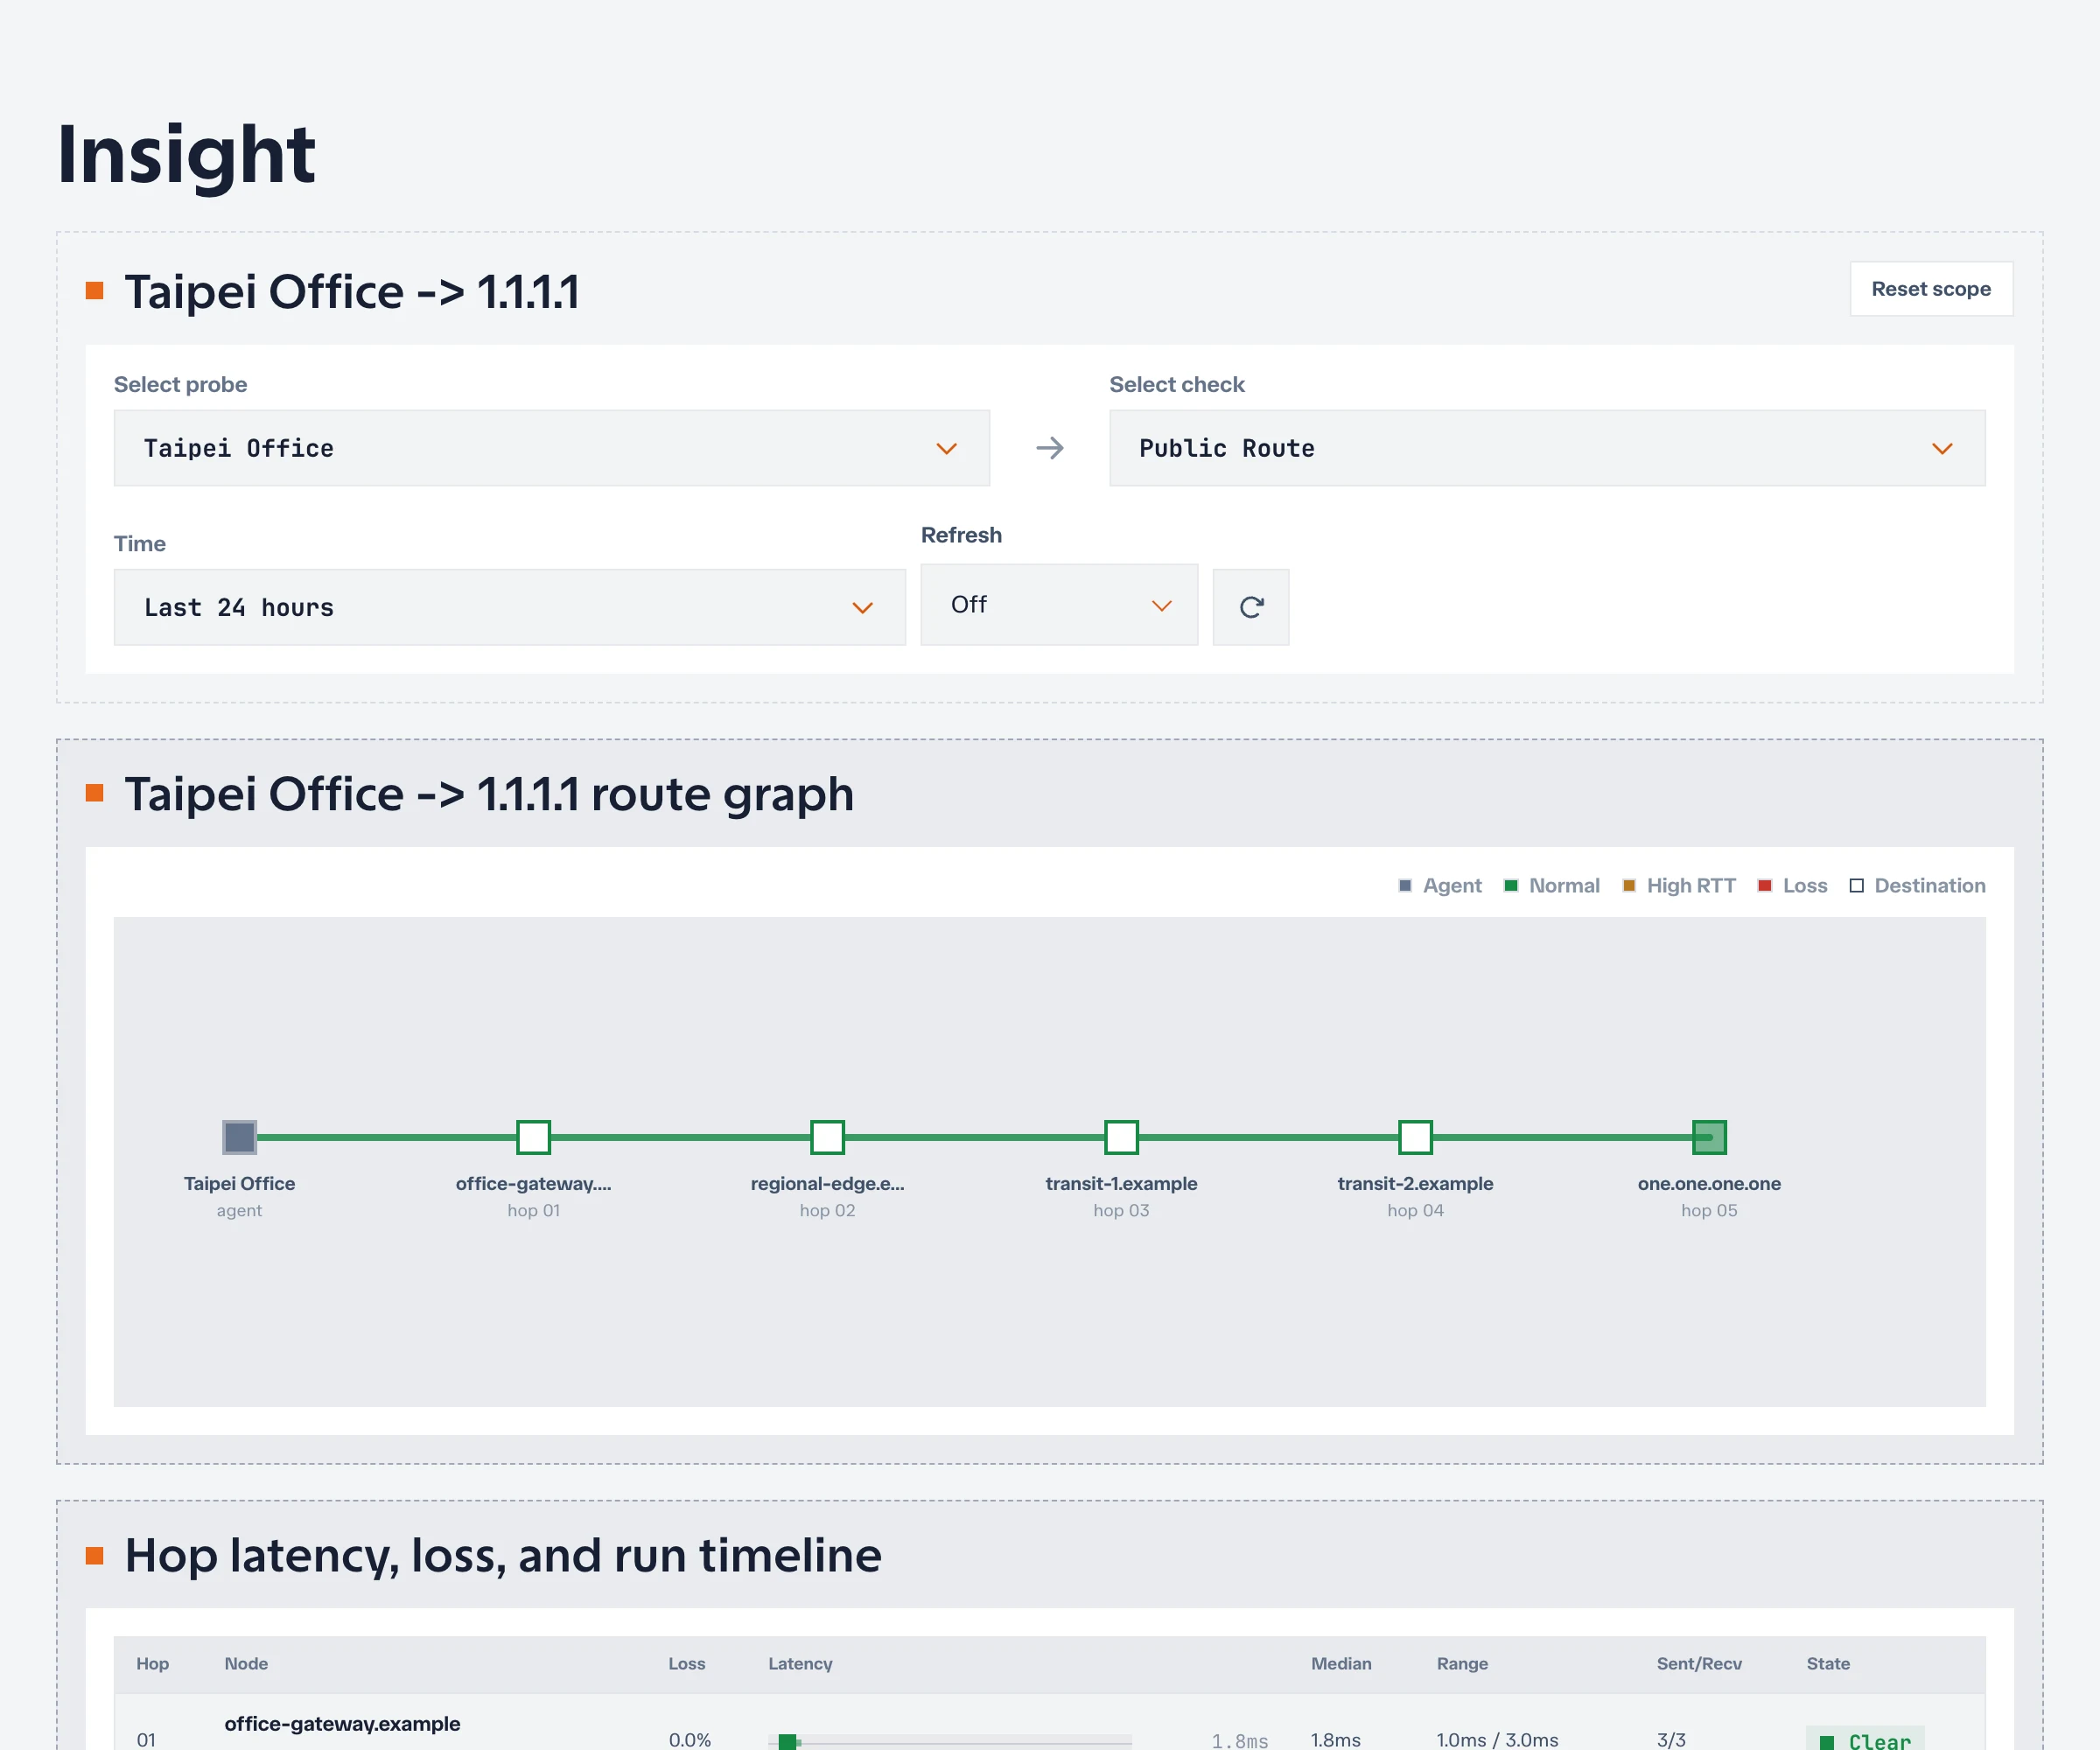
The graph identifies:
- The originating Agent or probe.
- Intermediate nodes observed in retained runs.
- The destination when it responded.
- Normal, high-RTT, and loss states calculated from the available observations.
- Alternative edges when different runs followed different paths.
Use the graph to locate where paths diverge or where an affected probe stops sharing the same route as healthy probes. Then select one exact assignment and use the timeline to inspect a real run.
Select a run from the timeline
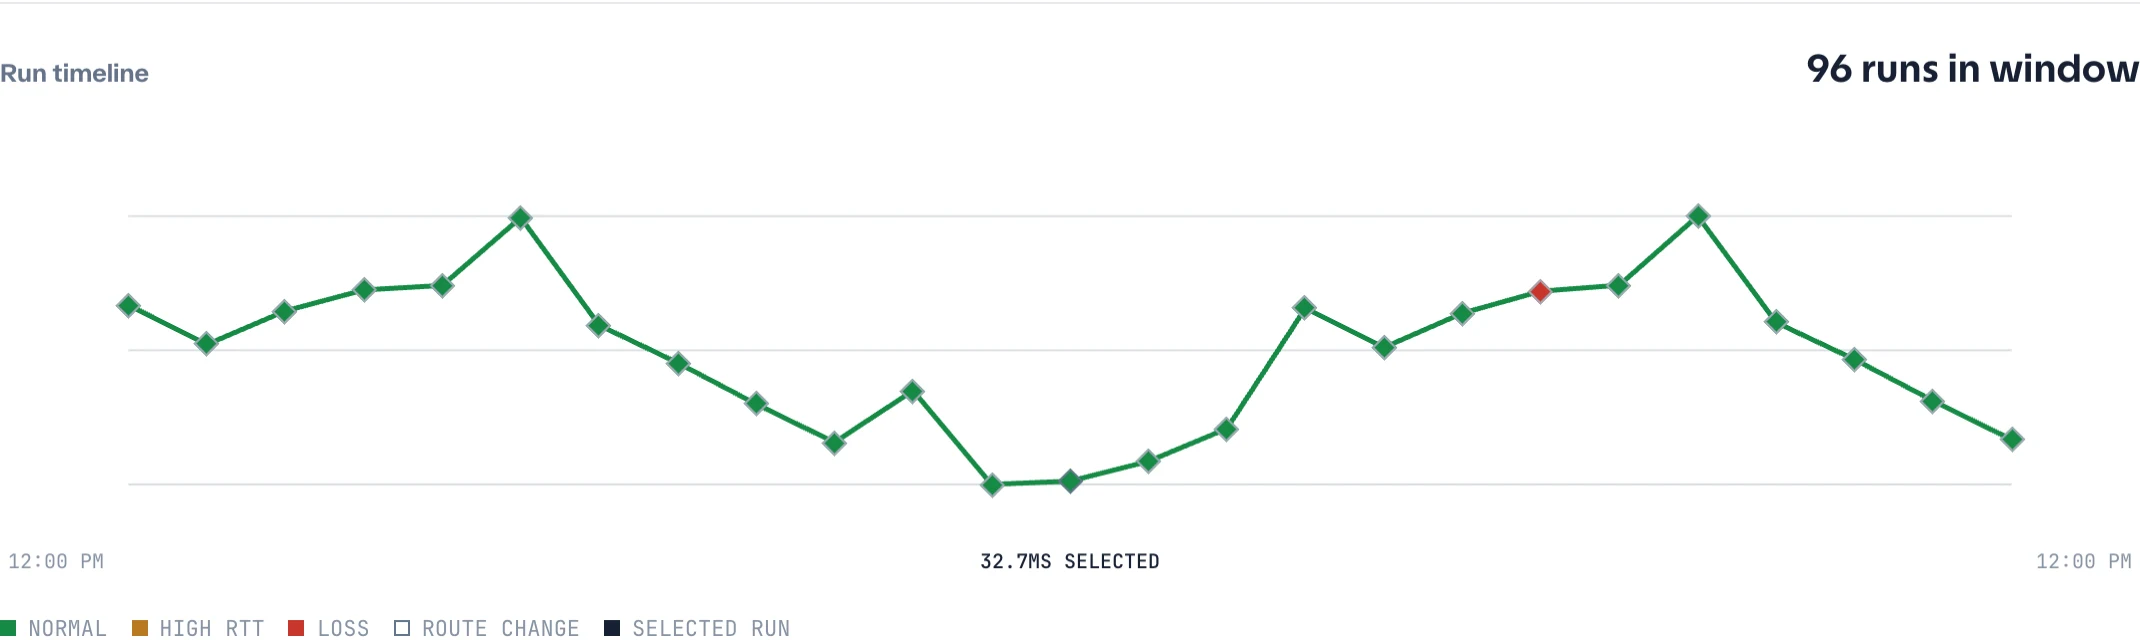
The timeline plots final responding-hop RTT across the selected time window. Its legend distinguishes normal runs, high RTT, loss, route changes, and the selected run.
Timeline behavior depends on the returned resolution:
- A raw point represents one retained run. Selecting it loads that run into the hop table and stores its start time in the URL.
- An aggregate point represents a bucket containing several runs. Selecting it narrows Insight to that bucket so raw evidence can be requested.
- Dragging across the timeline changes the global Insight window to an absolute range.
A route-change marker means the observed path differs from the preceding path. It does not prove an outage. Load the run before and after the change, then compare service behavior during the same interval.
Read one run’s hop table
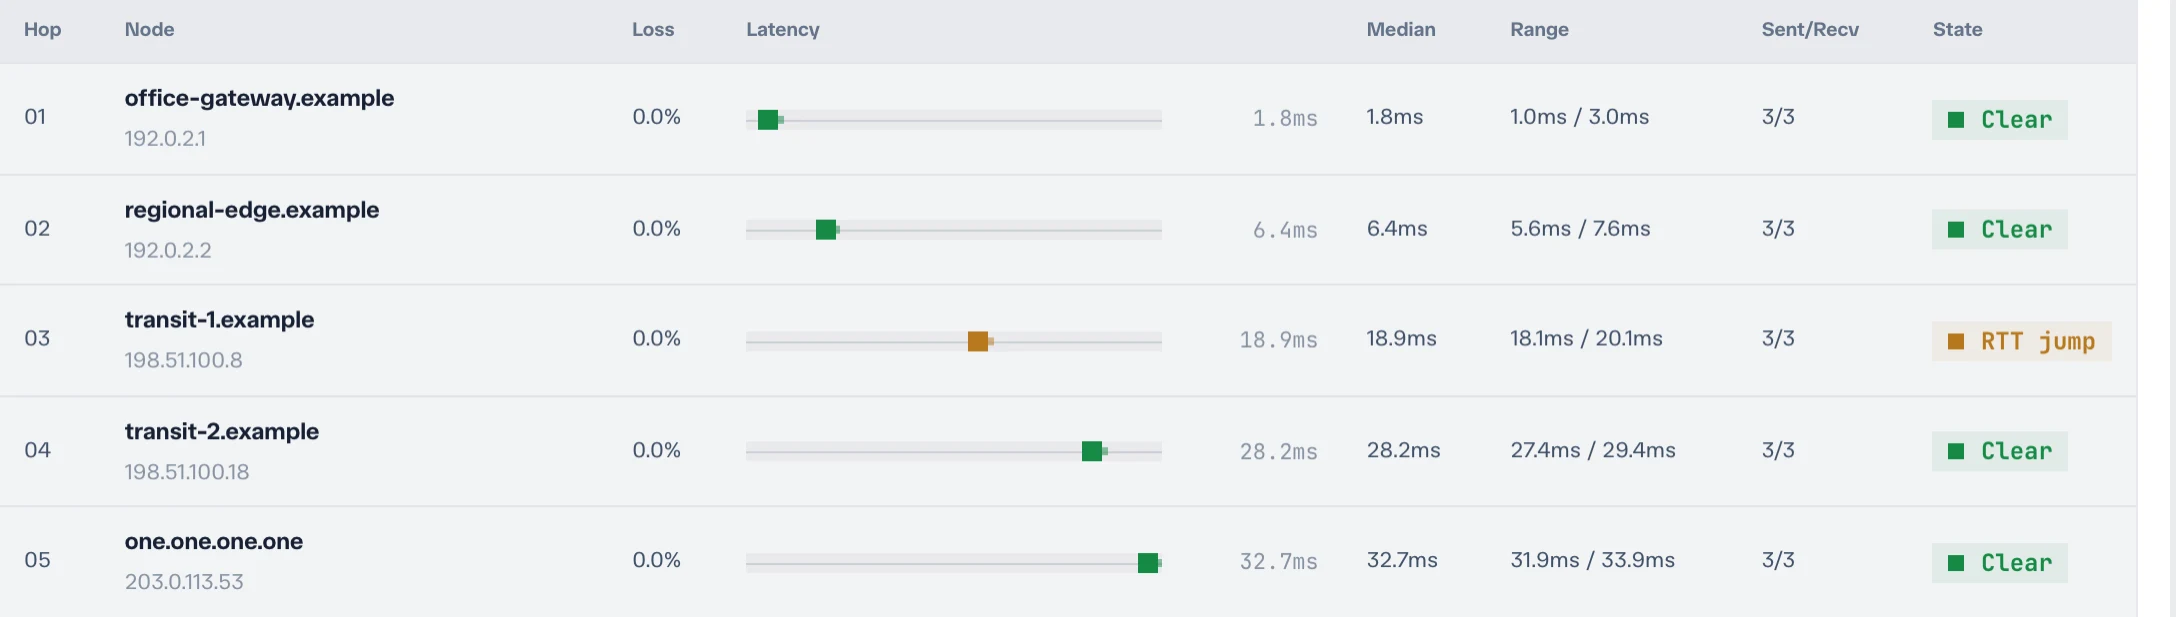
Each row represents one hop index in the selected run:
| Column | Meaning |
|---|---|
| Node | Resolved hostname and observed address, when available |
| Loss | Percentage of sent probes without a reply at this hop |
| Latency | Minimum, average, and maximum RTT shown on a common rail |
| Median | Middle RTT sample, which is less sensitive to one extreme reply |
| Range | Minimum and maximum RTT for the hop |
| Sent/Recv | Probe messages sent and replies received |
| State | Netstamp’s diagnostic classification for the row |
Compare hop latency with the previous responding hop. A high value on one router is not automatically service latency; confirm whether the increase remains visible downstream and at the destination.
Understand hop states
| State | How Netstamp classifies it | Interpretation |
|---|---|---|
| Clear | No flagged loss or meaningful RTT increase | No issue detected in this run |
| No reply | Messages were sent but the hop returned no replies | Router may ignore or rate-limit Traceroute traffic |
| RTT jump | Average RTT increased by more than 10 ms and more than 20% from the previous responding hop | Possible path or processing change; confirm downstream persistence |
| Router-only loss | This hop lost replies but downstream responding hops did not preserve the loss | Usually ICMP rate limiting at the router, not forwarded traffic loss |
| Propagated loss | Loss is also present on every responding downstream hop | Stronger evidence of loss beginning at or before this point |
| Final loss | Loss is present at the last responding hop | Destination or final visible segment may be affected |
These states are diagnostics, not root-cause conclusions. Firewalls, control-plane protection, load balancing, and incomplete replies can all change what Traceroute exposes.
Avoid common false positives
An intermediate hop does not reply
If later hops and the destination still reply, the silent router is forwarding traffic. Treat the missing row as visibility loss, not proof of service loss.
One hop reports loss but later hops are clean
The router may rate-limit responses addressed to itself while forwarding transit traffic normally. Netstamp labels this Router-only loss. Do not escalate it without downstream loss or service impact.
RTT rises at one hop and falls later
Routers can deprioritize their own replies. Latency cannot physically be removed from the path, so a non-persistent spike is not evidence that transit traffic experienced the same delay.
The route changes but the service remains healthy
Routing protocols, anycast, ECMP, and load balancers can select another valid path. Investigate when a route change aligns with sustained loss, latency, connection failure, or HTTP degradation.
Different probes show different routes
This is expected when probes use different providers, regions, DNS answers, or peering relationships. Compare probes to explain scope rather than expecting identical topology.
Account for Traceroute limits
Traceroute cannot show the complete forward and reverse data path in every network. Interpret results with these limits:
- Return traffic can take a different path from the forward probes.
- MPLS, tunnels, NAT, firewalls, and private networks can hide hops.
- ECMP and per-packet load balancing can produce several valid paths.
- ICMP and UDP Traceroute traffic can be filtered or deprioritized differently from TCP or HTTP.
- Resolved hop names can be missing, stale, generic, or operationally misleading.
- The last responding hop may not be the application host.
Traceroute checks do not currently support alert rules. Alert on Ping, TCP, or HTTP service evidence, then use Traceroute during investigation.
Investigation workflow
- Identify the incident interval in Ping, TCP, or HTTP.
- Open the matching Traceroute check for one affected probe.
- Set the same absolute time window.
- Check the aggregated graph for path divergence.
- Use the timeline to select runs before, during, and after the event.
- Compare the first persistent RTT or loss change in their hop tables.
- Repeat the comparison with an unaffected probe.
- Share the URL with the selected run and note the timezone.
Return to Ping, TCP, and HTTP analysis to decide whether the path evidence matches user-visible service behavior.